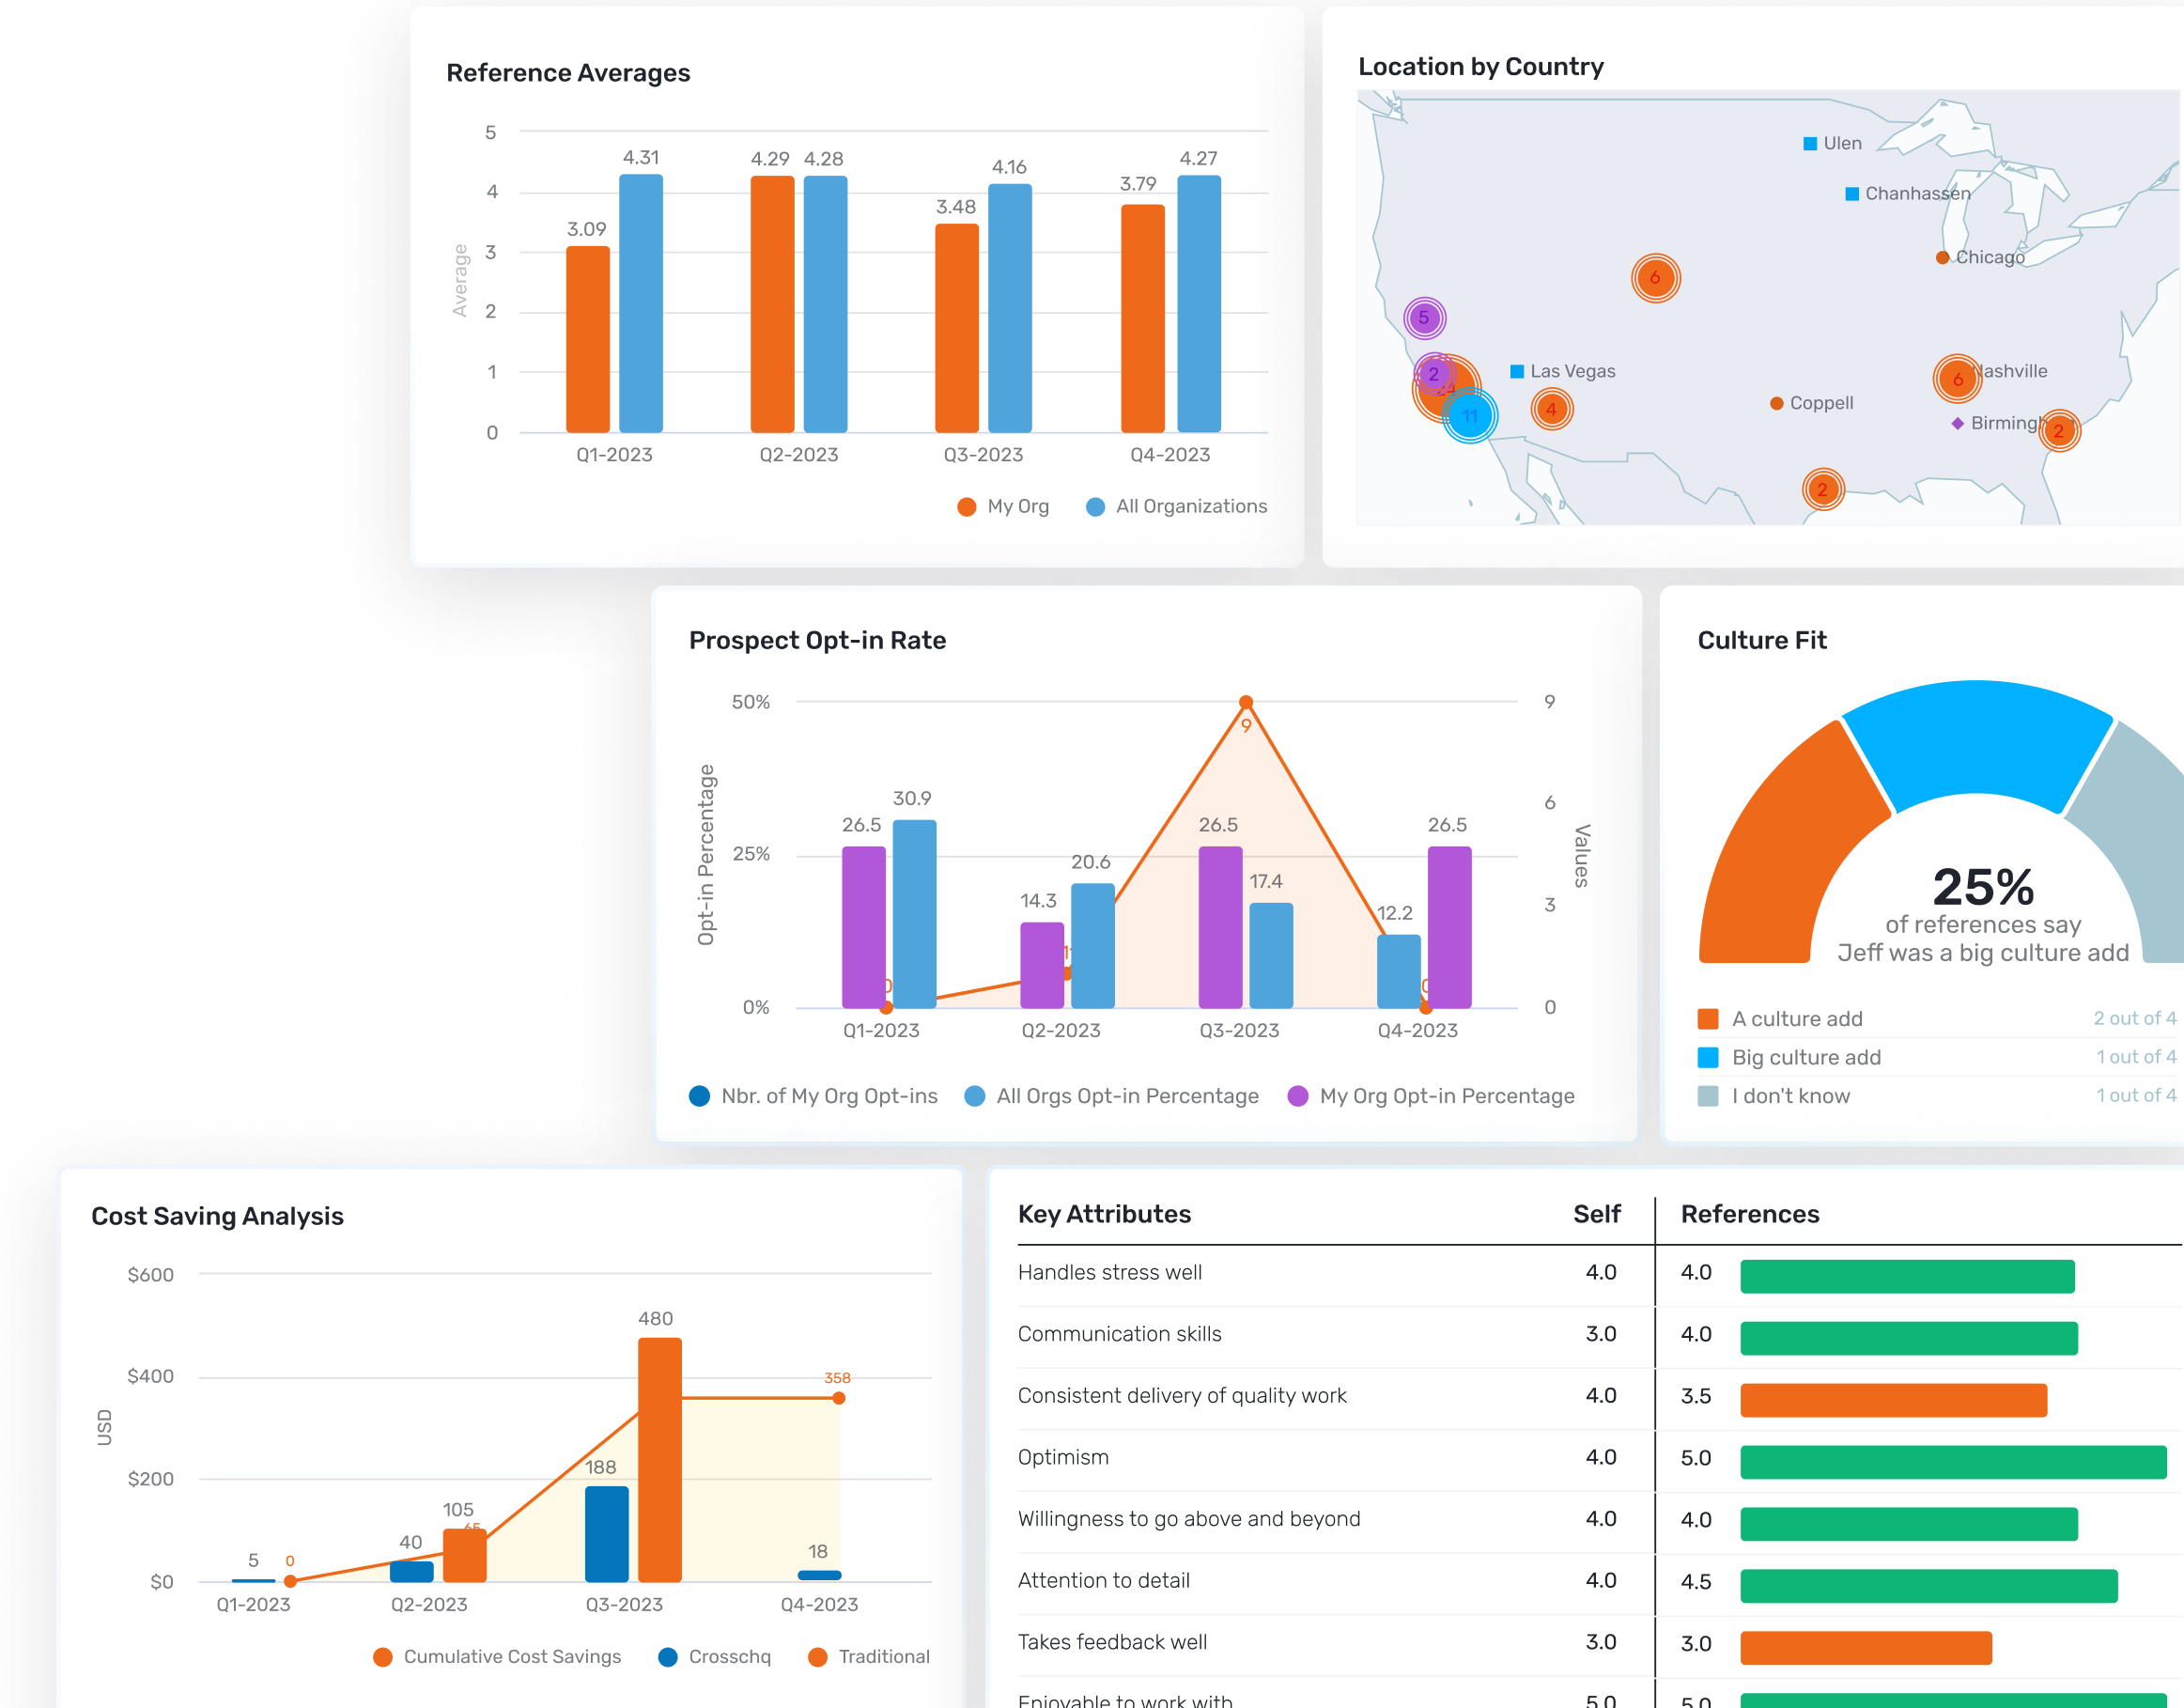
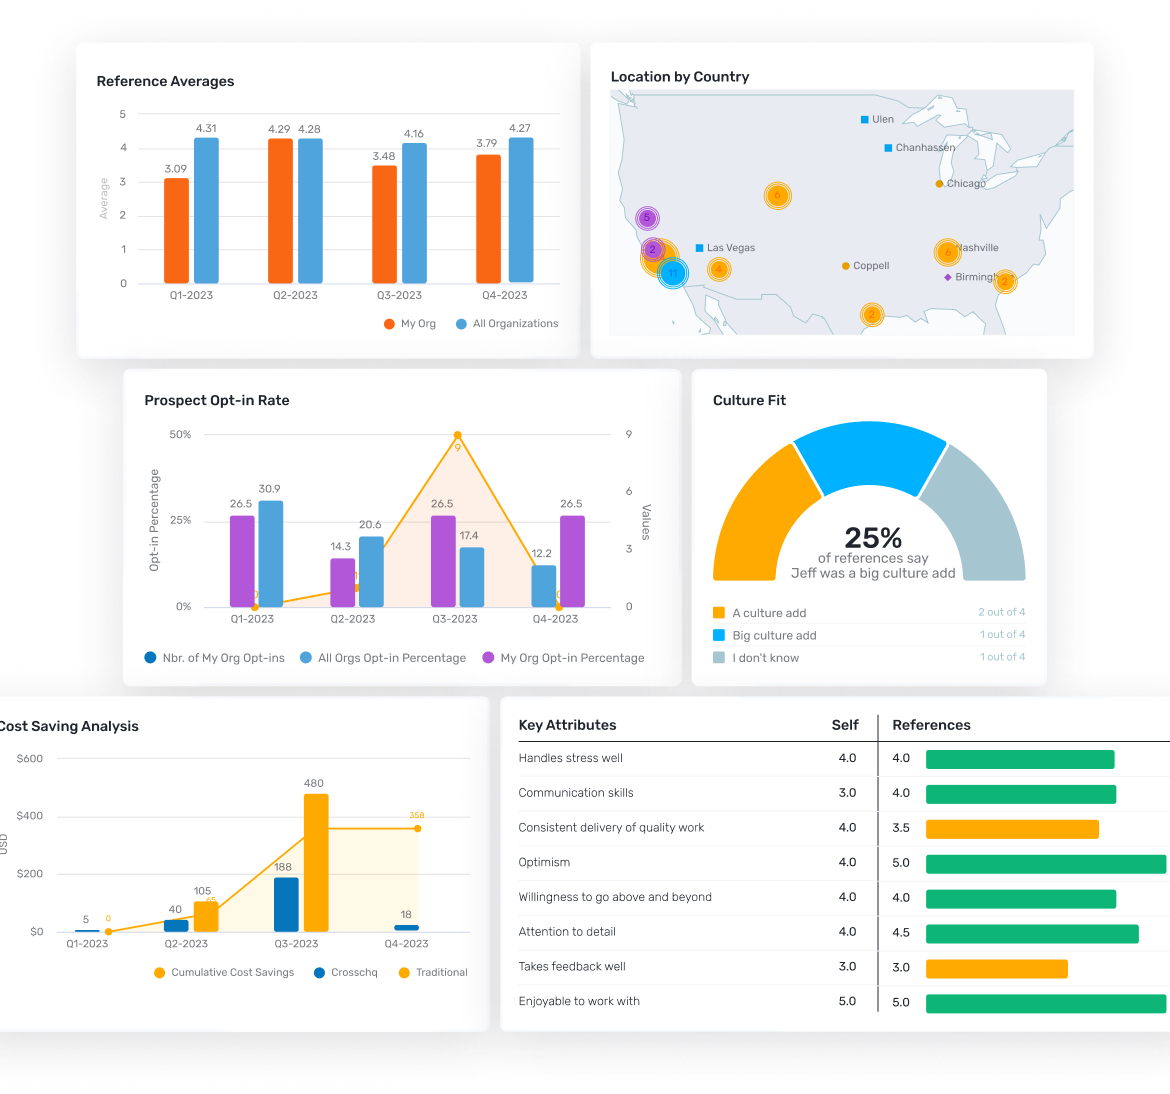
ANALYZING & OPTIMIZING

Hiring Demographics

Understand how your hiring processes are impacting bias, drop-off rates, candidate experience, and more. Crosschq's demographic data enrichment and analysis make it easy to locate areas of opportunity to improve processes.

TALK TO SALES
Solution Page Heros_03 (1)

TBD

p-logo-9-1 p-logo-5-1 p-logo-11-1 p-logo-12-1 p-logo-10-1 p-logo-7-1 p-logo-6-1 p-logo-8-1 p-logo-1-1 p-logo-2-1 p-logo-3-1

The Crosschq Solution: Visualize & Correlate the Impact


Many companies struggle to answer the most basic questions about how their hiring processes are impacting applicants of varying genders and ethnicities.

With easy to access out-of-the-box reports, Crosschq enables and empowers you to better understand how your existing strategies are impacting everything from bias in selection to candidate drop off and even candidate experience.

Crosschq can enrich your EEOC data by providing a comprehensive view of the diversity within your active pipelines.


Why Customers Turn to Crosschq

Easy Data Collection

Effortlessly collect survey data to add another dimension to your demographic reports.

Enriched Data

Crosschq enriches demographic data into 100% of your data with 90%+ accuracy rate, so you can hit the ground running with complete reports from Day 1.

Actionable Insights

Starting with answering basic demographic questions, take it one step further and correlate other data points to see which processes could use improvement.

Browse Other Crosschq Solutions

Core Recruiting Metrics

Make hiring decisions and strategic plans with more confidence

No more time spent pulling, updating and questioning reports. Track important recruiting metrics and gain clear, actionable insights.

LEARN MORE
Solution Page Heros_07

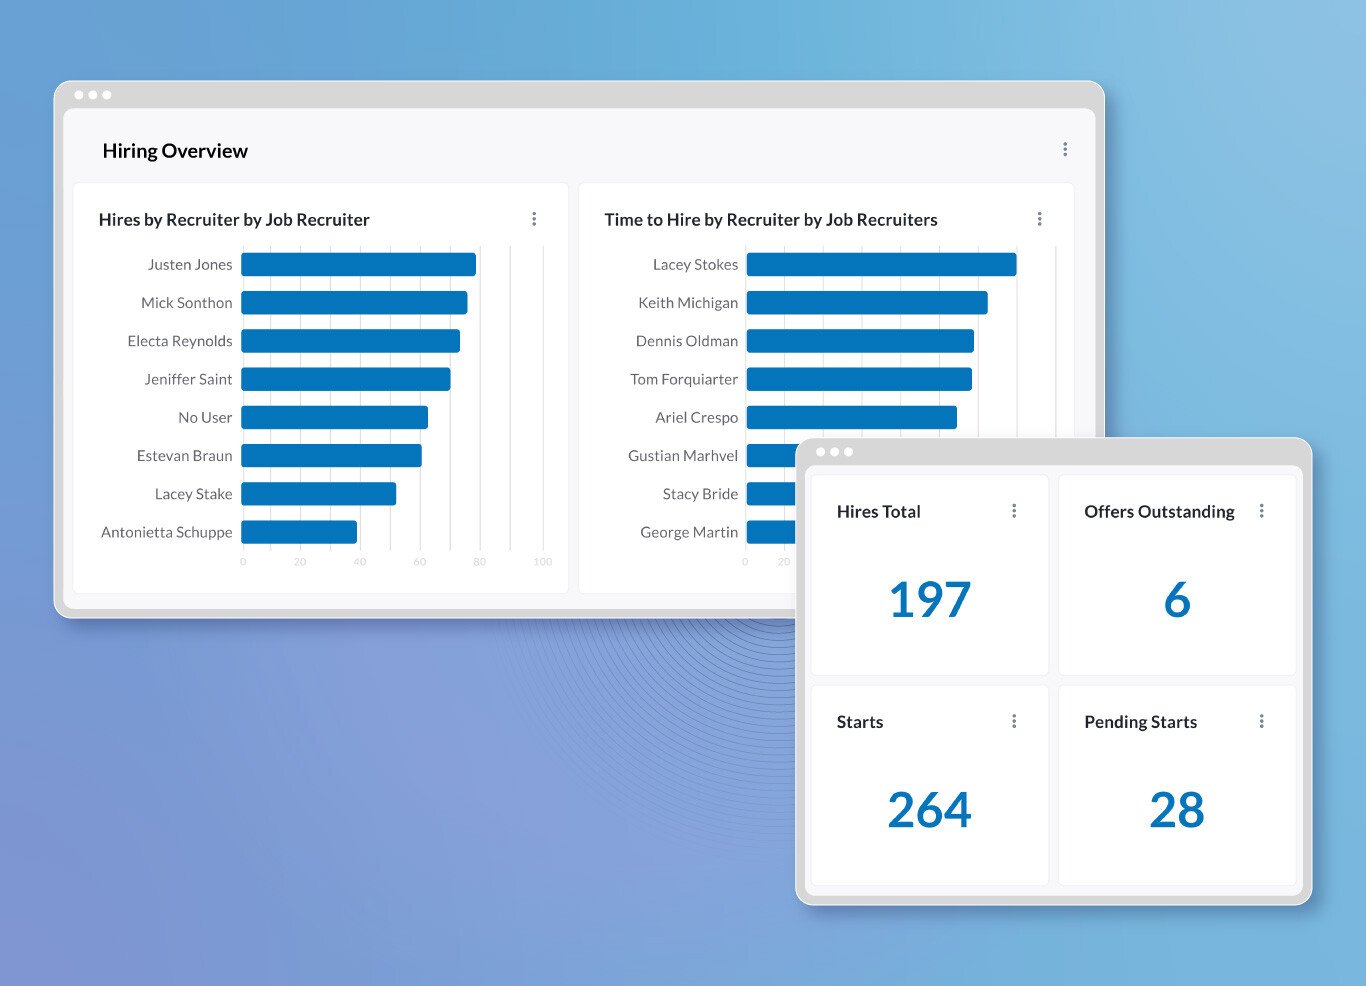
Pipeline Health and Plan Attainment

Understanding real-time candidate pipelines and overall job health

Crosschq has developed an incredibly easy-to-use visualization layer that helps both recruiters and hiring managers easily visualize the health of their pipelines.

LEARN MORE
Solution Page Heros_05

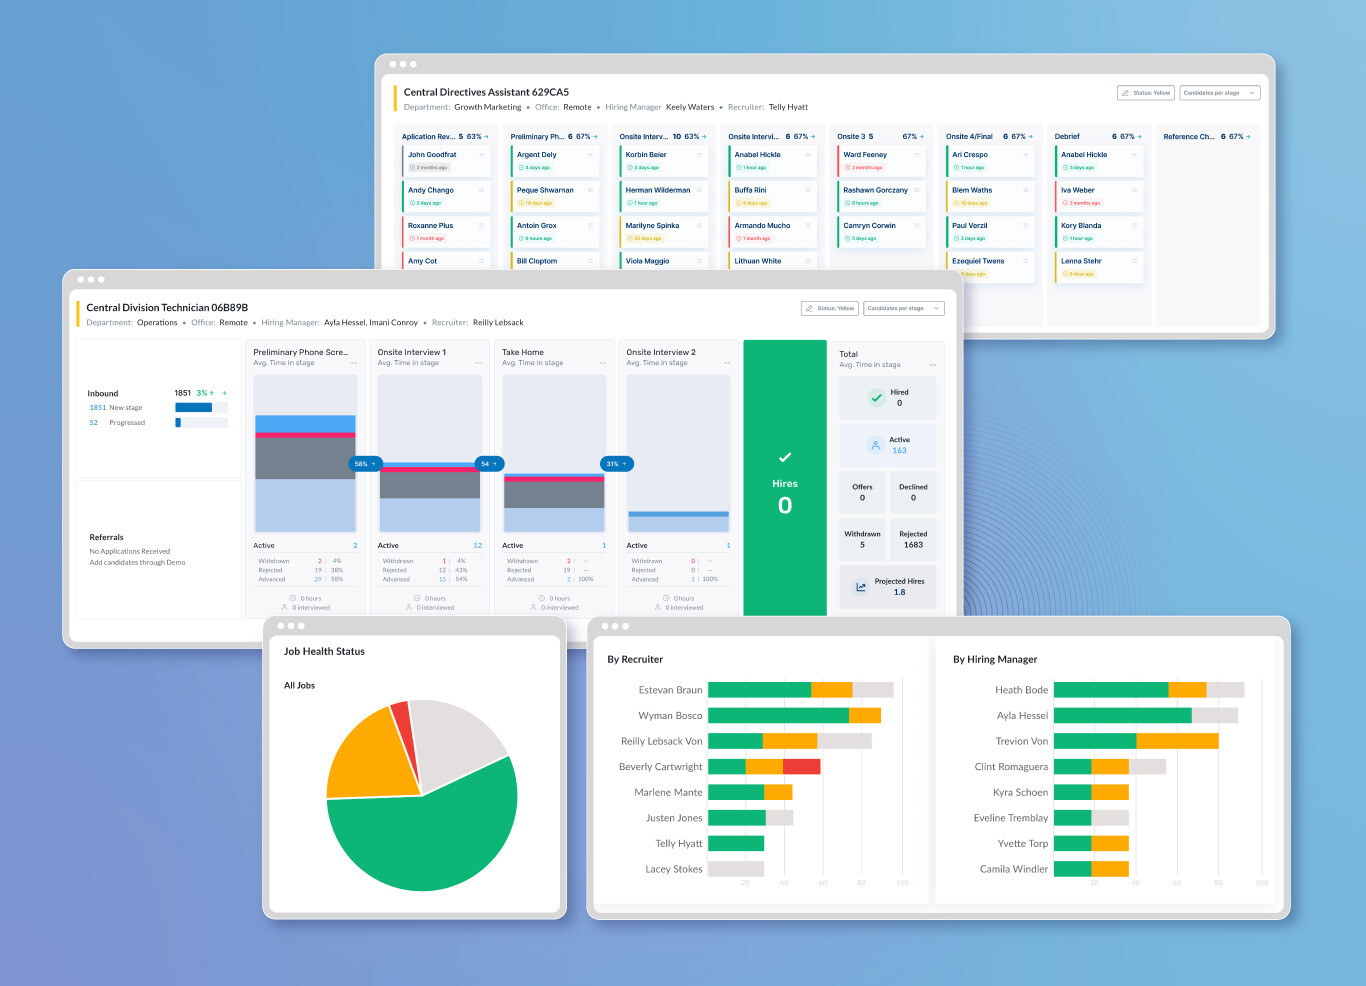
Candidate Experience

Keep a pulse on the experience right from your ATS

Trigger customized surveys at any step in the hiring journey so you can slice and dice the data to uncover areas for improvement.

LEARN MORE
Solution Page Heros_04 (1)
ATS Analytics Page_01 v2 (1)

My organization struggles with...

Defining
Quality of Hire

Lorem Ipsum

Measuring
Quality of Hire

Lorem Ipsum

Improving
Quality of Hire

Lorem Ipsum

Some Title

Some subtitle

54% believe QoH will be #1

According to LinkedIn, 54% of recruiting professionals believe Quality of Hire will be the #1 priority in the next 5 years but are not sure how to improve it.

26% more revenue per employee

Employees with high QoH scores are more engaged. Studies shows that organizations with highly engaged employees capture 26% more revenue per employee.

400% as much productivity

Employees who are high-performers can deliver up to 400% as much productivity as employees who perform poorly, indulge in presenteeism, or are unengaged and unmotivated.

Quality of Hire will be the #1 prioritity for recruiting professionals over the next 5 years" - LinkedIn

ESTABLISH
QUALITY OF HIRE
AS A CORPORATE KPI

Quality of Hire-Analytics Page_Hero v3-2-1

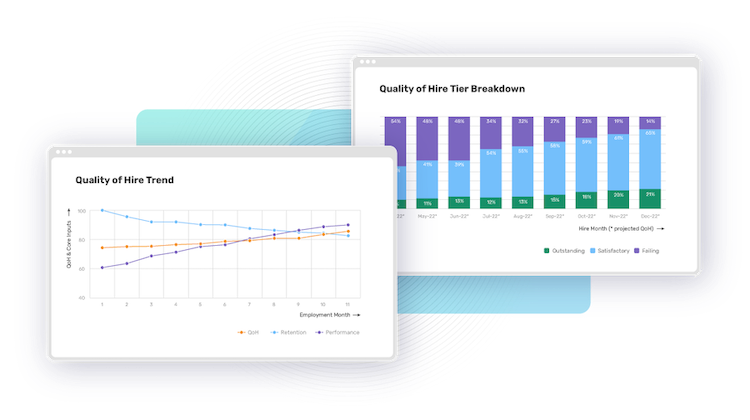
Tie sourcing, interviewing & hiring decisions to employee retention & performance

Establish Your QoH Baseline

Consistently measure Quality of Hire, and see where you stack up against industry benchmarks.

Uncover Areas of Opportunity

Filter & segment to quickly see if Quality of Hire varies by department, hiring manager, recruiter, office and more.

Predict the Perfect Candidate Fit

Ensure pre-hire assessments yield top performers by linking pre-hire data, like skills & values, to post-hire success for each role.

Take the Guesswork
Out of Hiring

Schedule a demo now
ESTE_cropped este_sm cta_light