%20-200x43.png)
.svg)
.svg)
.svg)
.svg)


.png)


![]() Crosschq Blog
Crosschq Blog
Recruiting Dashboard: A Complete Guide

Even with powerful data analytics systems and data-gathering tools, your analytics will only be as useful as your ability to make sense of them and turn them into action. Smart hiring solutions simplify all that data with readable reporting, sleek images, and easy-to-share features.
In fact, the dashboard is where you’ll access most of your metrics, visuals, reporting, and other data-related and performance needs. Read on to learn more about why recruiting dashboards are so important to the hiring process and how you can make the most of your recruiting dashboard today.
What is a recruiting dashboard?
A recruiting dashboard is hiring intelligence software that provides you with information on how your hiring process is performing. Dashboards include things like:
- Key performance indicators
- Hiring metrics
- Detailed reporting
- Visuals
- Graphs and models
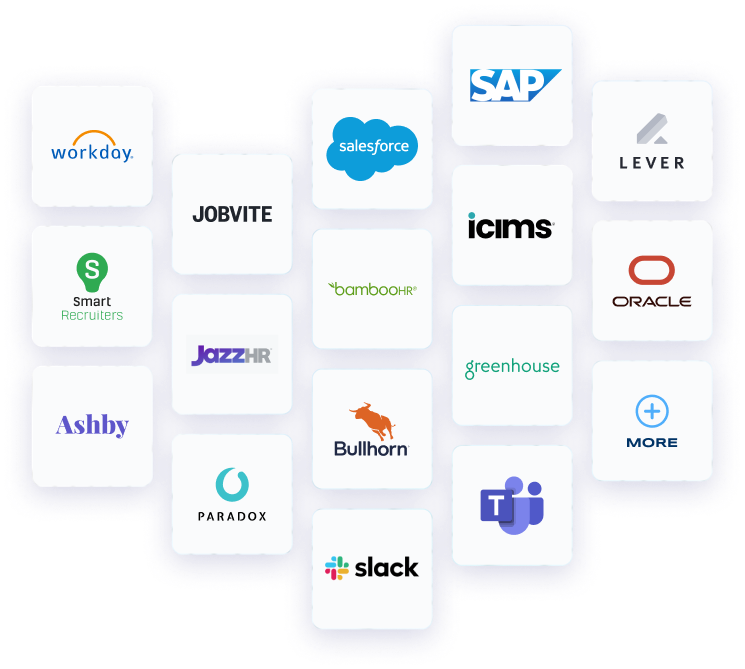
- API integrations
- New-hire metrics
- Operational deadlines
- Budgeting and forecasting
- And more
Dashboards provide you with feedback and answers to important questions that you might come across in the hiring process. They aren’t a collection of random metrics and reports; rather, they provide you with a bird’s eye view of your overall performance and hiring ecosystem.
What metrics should be included in a recruiting dashboard?
You can pick and choose what kind of metrics you want to track through your dashboard. In most cases, your dashboard will include the most important hiring metrics, which include:
- Quality of hire: Quality of hire is a top priority for most hiring teams because it reflects the value that a new hire provides to your company. Advanced solutions, like Crosschq, will prioritize quality of hire by integrating advanced reporting and sourcing optimization.
- Headcount metrics: Headcount metrics are essential to planning your future hiring cycles and needs as a company.
- Time to hire: This is a good, quantitative metric that can tell you how long it takes to fill your positions on average. Time to hire should be used in conjunction with quality of hire because a fast time-to-hire rate won’t mean as much if you aren’t securing quality hires.
- Cost per hire: Another important quantitative metric is cost per hire, which, no surprise, reflects your average cost per new hire. Again, spending a little more on quality hires that don’t yield high attrition rates is probably better than lowering your costs as much as possible without
- Sourcing effectiveness: You can assess the efficacy of your sourcing channels with this metric. Your dashboard will make it easy to determine which channels lead to the most and best hires.
- Acceptance rate: How many hires accept a position after an offer has been given? This is a simple metric that lets you know how effective you are at securing candidates once you’ve made an offer.
Recruiting dashboard benefits
Teams that use state-of-the-art recruiting dashboards will have an advantage over their competitors. Recruiting dashboards provides teams with the information and insights they need to turn analytics into action. Here’s how you can benefit from your recruiting dashboard today.
- Talent acquisition insights: Modern hiring tools come with a talent acquisition dashboard that breakdown all the most important metrics, hiring insights, budgeting information, deadlines, and other key hiring information. You get everything from the bird’s-eye view of high-level overviews, as well as specific performance measures for minute details.
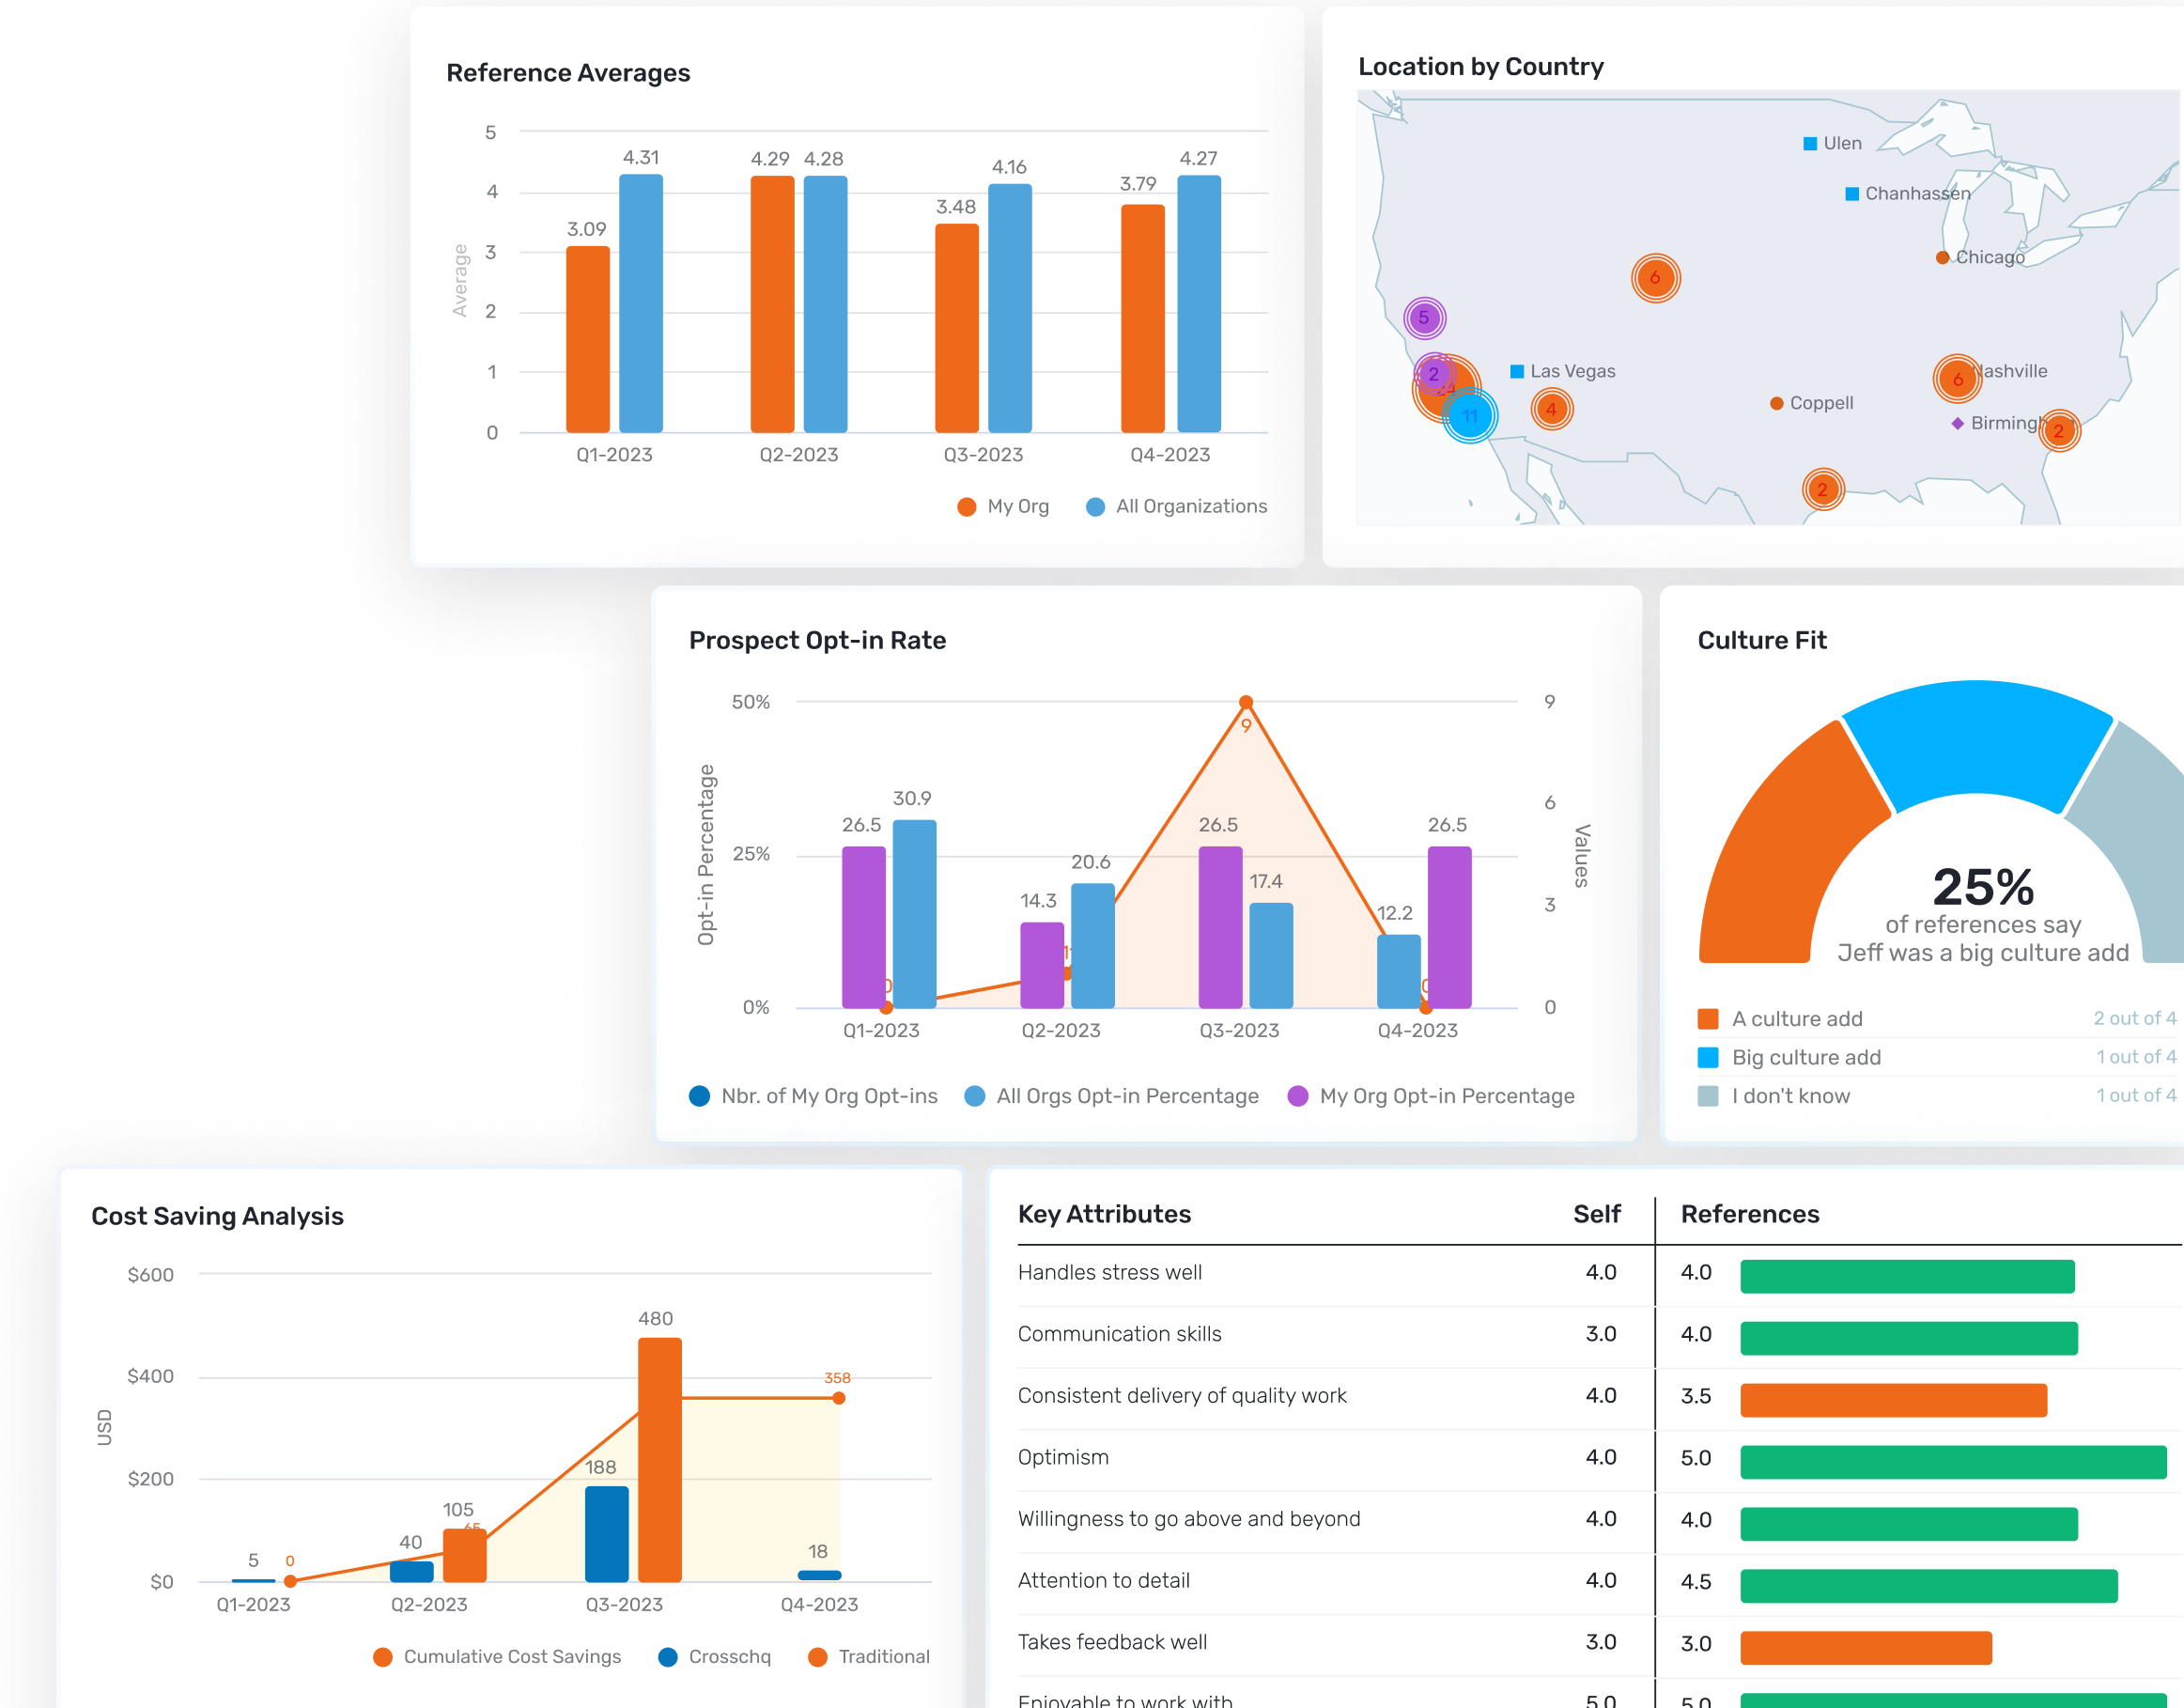
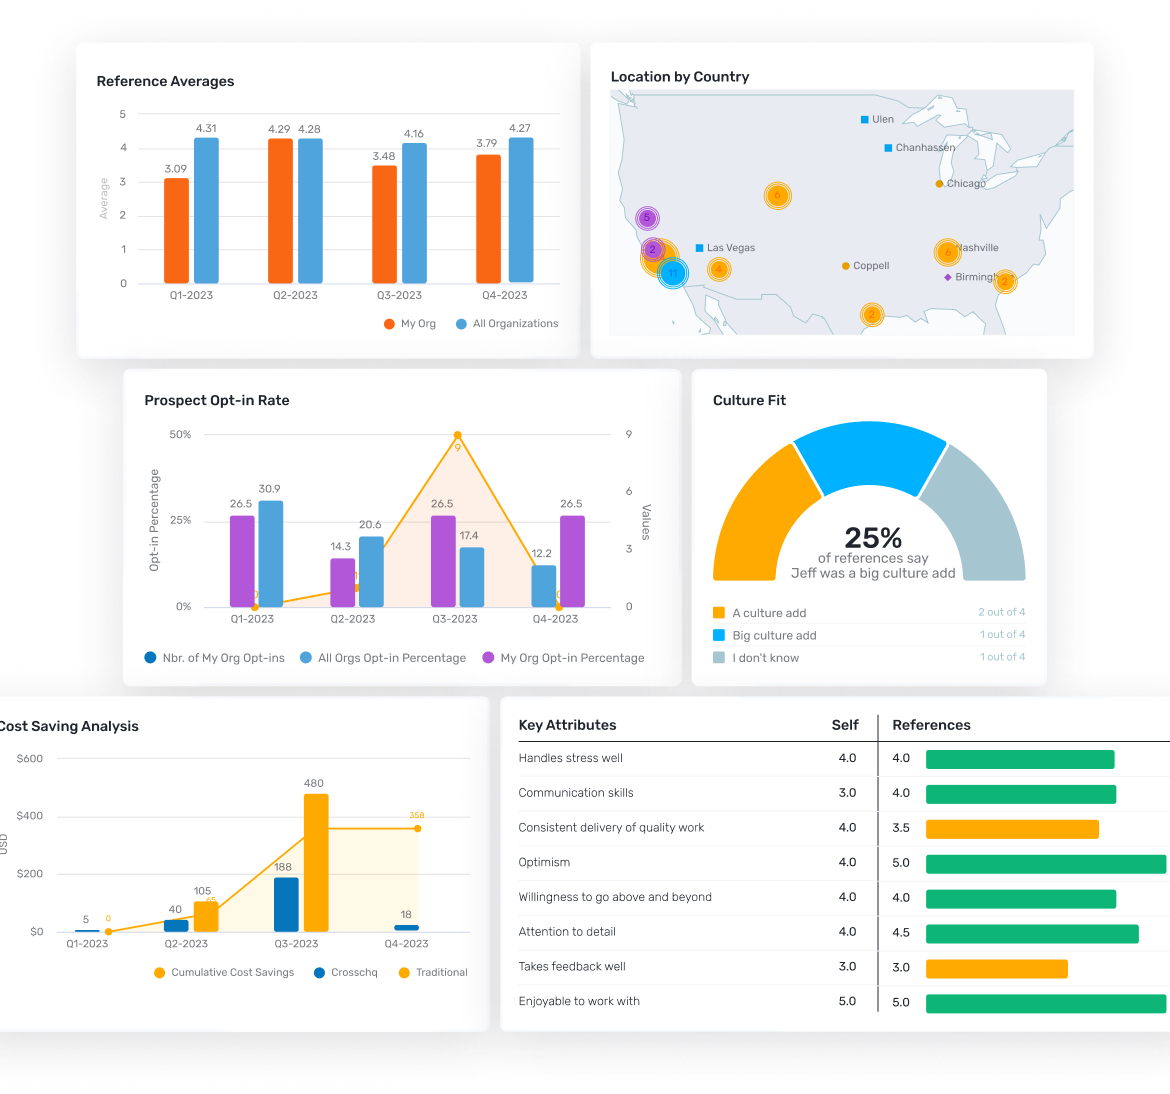
- Visual displays and reporting: At Crosschq, we offer 100+ reports just for quality of hire. On top of that, you get a variety of visuals, models, and charts that make it easy to track and follow your most important metrics and performance indicators.
- Increased efficiency: You can expect your cost per hire, time to hire, and overall recruitment time to decrease with an advanced recruiting dashboard. Since you’ll be able to identify the best hiring channels, interview panels, and other hiring practices, you can expect your efficiency to improve.
- Insights become shareable and reportable: If you need to share insights during a team meeting or with your stakeholders, a recruiting dashboard will make it easier to disseminate that information and turn insights into presentable content.
- Customize your dashboard: Do you prefer statistics over visuals? Pie charts over written reports? Advanced dashboards will give you the tools to customize reports and prioritize specific reporting modes of others.
Why Crosschq has everything you need in a dashboard
With talent acquisition analytics, quality of hire metrics, ATS insights, and other important recruiting KPIs, Crosschq gives you the deep insight you need to turn data into action. Benefit from hundreds of automated reporting, simplified visuals, shareable images, a single source of truth for all hiring data, and unprecedented visibility across your entire hiring ecosystem.
Request the demo to learn how you can boost your quality of hire by 34 percent, increase recruiter efficiency by 28 percent, and cut your time spent on reference checks by 95 percent with Crosschq today.
Take the Guesswork
Out of Hiring
Schedule a demo now