%20-200x43.png)
.svg)
.svg)
.svg)
.svg)


.png)


Benchmarked metrics are the key to supporting progress in any industry, and recruitment is no different. Without benchmark recruiting metrics, it is impossible to track progress or identify issues in your recruiting funnel.
Recruiting benchmarks are critical to the success of your organization. Companies across the world are already investing in programs and platforms to help them leverage metrics as part of their overall business strategy. Identifying and benchmarking the correct recruiting metrics is the path forward for improving candidate experience and elevating Quality of Hire.
Basic Benchmark Recruiting Metrics Rules
To be useful, talent acquisition benchmarking needs to establish a baseline for a metric that:
- Is able to be continually updated with new data
- Can be easily measured and compared over time
- Is capable of providing insight into specific outcomes
- Can be acted on to improve those outcomes
Lack of benchmarks means you have no way to measure incoming data and figure out what is or isn’t working. Choosing and using specific recruiting funnel metrics can mean the difference between a scattershot approach to hiring, and a clear, well-thought-out direction for your recruiting team that includes better pipeline management.
Top Recruiting Benchmark Metrics
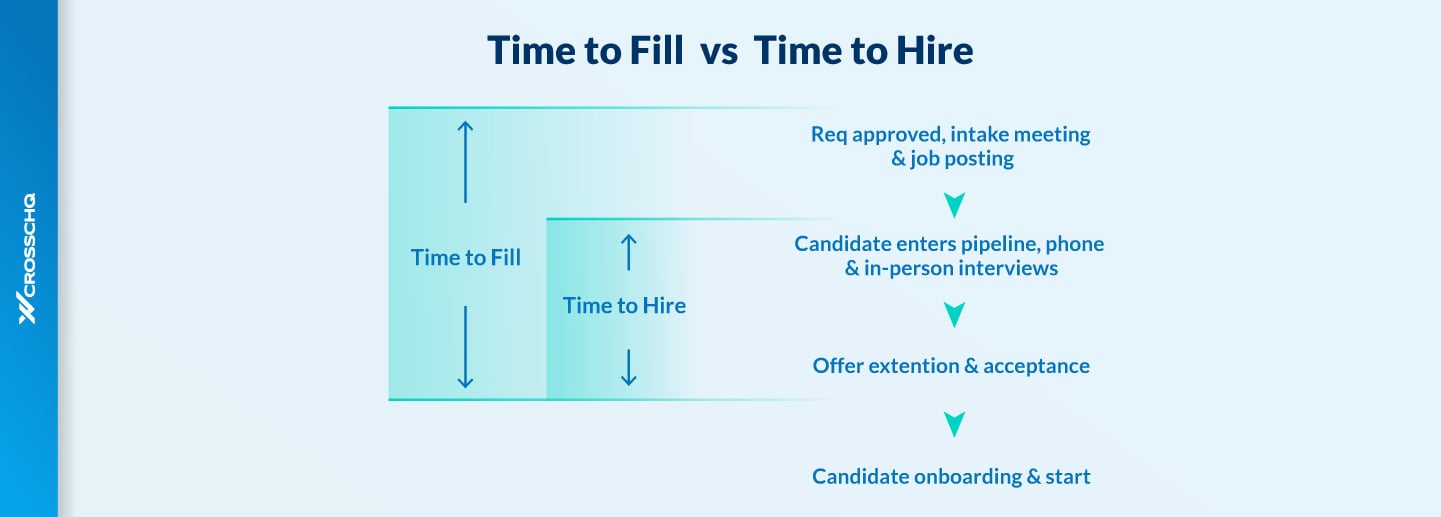
Time to Hire
DEFINITION:
Time to Hire is a subset of Time to Fill, consisting of the time period between when a candidate submits their resume and when the candidate accepts the offer.
FORMULA/CALCULATION:


WHO CARES ABOUT THIS METRIC?
The main stakeholders when it comes to Time to Hire could be the head of the department where the job vacancy exists, the hiring manager who needs the seat filled, and the recruiter who is under pressure to show performance and results.
HOW TO IMPROVE THIS METRIC:
Time to Hire can be improved by focusing on areas of the hiring funnel that aren’t performing as expected. Shorten Time to Hire by:
- Visualizing each candidate’s journey through the pipeline, including pass-through rates and time-in-stage.
- Pinpointing bottlenecks or roadblocks in the hiring process that prompt unwanted candidate drop-off and poor candidate experience.
- Improving engagement and top talent candidate withdrawal with personalized and timely communications.
Time to Fill
DEFINITION:
Time to Fill is the time period between when a job requisition is opened in the Applicant Tracking System (ATS) and a candidate is marked in the ATS as hired.
FORMULA/CALCULATION:

BENCHMARK:
According to SHRM’s latest survey, the average Time to Fill is 41 days. This data includes all industries and all company sizes. Average Time to Fill can vary widely based on many factors.
WHO CARES ABOUT THIS METRIC?
The main stakeholders when it comes to Time to Fill could be the head of the department where the job vacancy exists, the CFO who is noting the cost of recruiting over time, and the COO, who is watching loss of production due to the vacancy.
HOW TO IMPROVE THIS METRIC:
Time to Fill starts before a candidate ever enters the pipeline, but the pipeline construction is part of the process. Shorten Time to Fill by:
- Getting recruiters, hiring managers, and other stakeholders on the same page as far as what an ideal candidate looks like.
- Working to develop a job description that provides potential applicants with clarity on the requirements, responsibilities, and compensation associated with the position.
- Taking Quality of Hire into account even while striving to fill roles quickly to avoid costly bad hires.
Source of Hire
DEFINITION
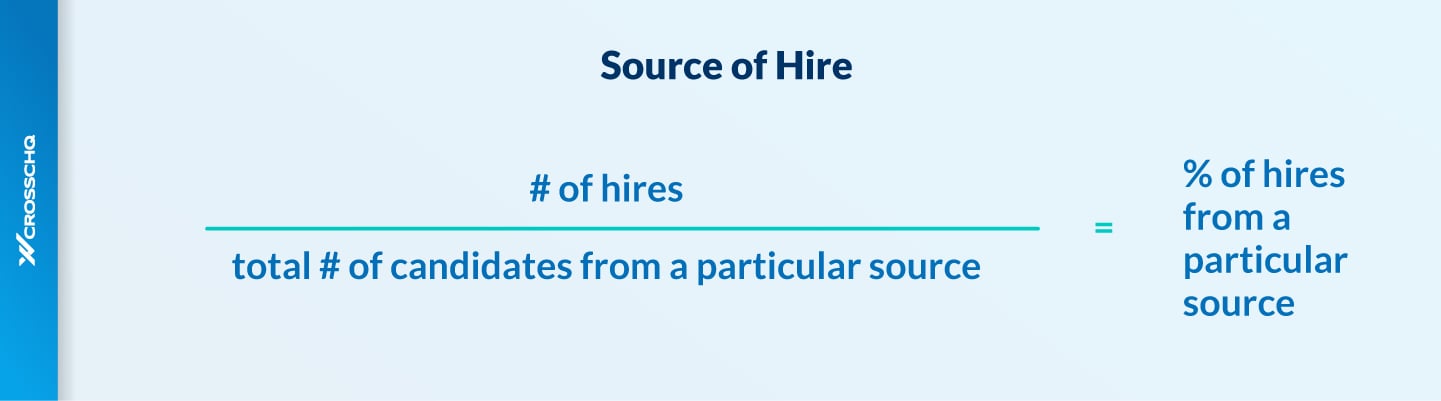
Source of Hire represents what percentage of overall hires entered the pipeline from each recruiting channel or source, such as job boards, referrals, or direct sourcing.
FORMULA/CALCULATION
Source of Hire should be calculated by dividing the total number of new hires from all applicants sourced through each channel, then repeating for all other channels and comparing results. However, this only provides insight into which hiring source is most prolific at generating new hires. Deeper insights are required to determine which Source of Hire is delivering the best quality employees based on post-hire performance.
BENCHMARK
Benchmarks will vary based on an organization’s recruitment strategy. Employee referrals may have the highest offer acceptance rate, but job boards may end up delivering higher quality candidates, or vice versa. According to data from Silkroad, the most common sources of hire include:
- 31% – Job board or aggregator
- 22% – Employee referral
- 11% – Internal hire
- 11% – Company career site
- 10% – Agency
WHO CARES ABOUT THIS METRIC?
Recruiters, HR personnel, and COOs in charge of recruitment budgets have a stake in this metric. So may existing employees, who may feel strongly about where new hires come from and whether or not they think they are well suited to the job and company culture.
HOW TO IMPROVE THIS METRIC:
To improve Source of Hire metrics, it’s critical to see if highly ranked Sources of Hire are born out by delivering employees who perform well and have a long shelf life. You should:
- Calculate Source of Hire for total number of hires, applicants, and interviews and offers per source, not just hires.
- Compare Source of Hire data with post-hire data that shows Quality of Hire metrics like performance and retention.
- Base budget decisions on which source is providing the best ROI when it comes to new hires: not just based on quantity, but on quality.
Quality of Hire
DEFINITION:
Quality of Hire is most clearly portrayed as the value a new hire brings to the organization adjusted over time. All other metrics should be viewed through the lens of Quality of Hire.
FORMULA/CALCULATION:
We calculate Quality of Hire using the following factors weighted for accurate results: performance, retention, culture add, engagement, promotability, and re-hireability.

BENCHMARK:
Quality of Hire will vary from organization to organization, but should always be expressed as a score. Scores for all employees can be added and divided by the number of employees to arrive at a companywide benchmark. Scores can also be calculated by department, etc.
Quality of Hire scores can be broadly placed into four buckets
- Excellent: 90-100
- Good: 80-89
- Average: 70-79
- Below Average: below 70
WHO CARES ABOUT THIS METRIC?
Recruiters, hiring managers, department managers, and COOs are all potential stakeholders, especially when it comes to performance and retention values.
HOW TO IMPROVE THIS METRIC:
Without Quality of Hire, all recruitment efforts will have reduced ROI. Quality of Hire can be improved by:
- Using analytics and employee surveys to follow employees through their new hire period, tracking progress, and continually updating Quality of Hire scores.
- Comparing employees with high scores and identifying attributes that contribute to Quality of Hire.
- Using these attributes to build candidate profiles to surface high-performers during the recruitment process.
Try This Blog Next:
Key Candidate Quality Indicators to
Boost Your Talent Acquisition and Quality of Hire
First Year Attrition Rate
DEFINITION:
Also commonly presented in reverse as “candidate retention rate”, first-year attrition rate this is the percentage of employees who are terminated or quit within 12 months of starting their new job.
FORMULA/CALCULATION:

BENCHMARK:
According to Work Institute’s 2020 Retention Report, 37.9% of survey respondents self-reported leaving a job before 12 months were up.
WHO CARES ABOUT THIS METRIC?
Benchmarking this metric can help HR teams and hiring managers identify disconnects between hiring expectations and realities on both sides.
HOW TO IMPROVE THIS METRIC:
This metric ties closely to Source of Hire and Quality of Hire. If hiring seems to be going well on the recruiting end, but post-hire data shows a high number of new hires are churning before the 12-month mark, something might be amiss with the candidate selection or post-hire onboarding processes. Reduce first-year attrition by:
- Looking for patterns in new hires subject to first year attrition to help shed light on where the recruitment process went wrong.
- Having employees who quit complete exit surveys, and supervisors complete internal surveys for involuntarily terminated workers.
- Reviewing onboarding processes and manager check-ins to ensure continued alignment.
- Examining your company culture to see if the workplace environment could be contributing to first-year attrition.
HIRING DIVERSITY
DEFINITION
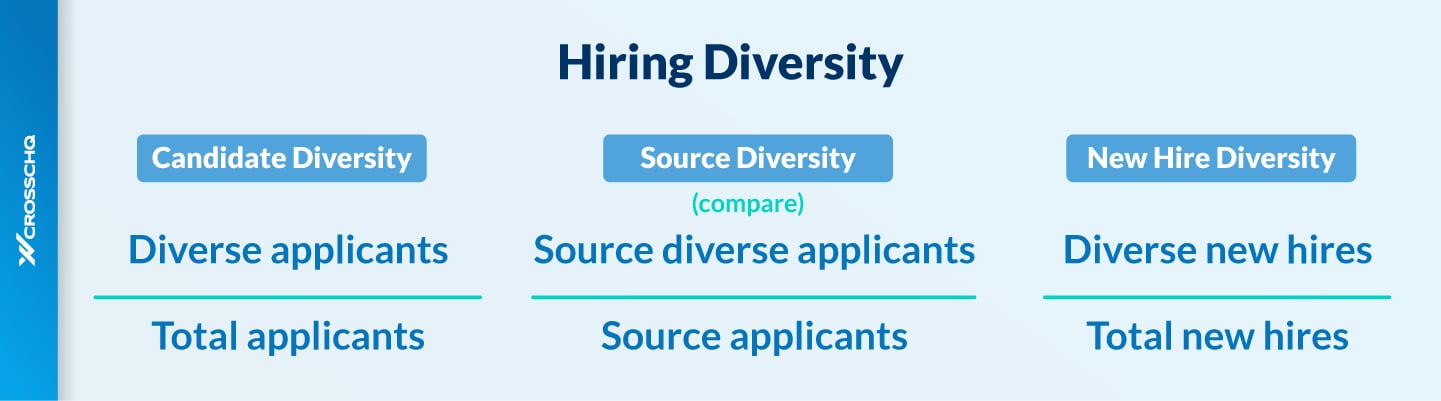
Pipeline and hiring diversity metrics require analysis of top-of-funnel sources for their delivery of diversity candidates and hires.
FORMULA/CALCULATION
You can find various ways to express your diversity metrics.
- Determine share of your candidate pool that is diverse, track over time
- Check candidate diversity by source
- Calculate the percentage of new hires that are diverse, also track over time
- See how many diverse candidates enter the recruiting funnel, and how many make it to the interview stage or hiring stage.
.jpg?width=1441&height=790&name=Benchmark%20Formula_10%20Diversity%20Funnel%20Dropoff%20(2).jpg)
BENCHMARK
Ideally, you’ll have at minimum a population-representative array of diversity in your pipeline. Be wary of double- or triple- counting candidates who fit more than one criteria.
WHO CARES ABOUT THIS METRIC?
HR very definitely cares about accomplishing diversity in hiring. So should the C-suite, from both a reputation perspective and a revenue perspective.
HOW TO IMPROVE THIS METRIC
Improve hiring diversity by:
- Remembering it’s not about filling a quota, but improving your bottom line thanks to the innovation diversity in hiring provides.
- Identifying when and where diverse candidates leave the recruitment process, and taking steps to fix the issues revealed
- Investing in platforms and tools to reduce bias in the recruitment process. And developing an interview team that is well balanced.
Pass-Through & Drop-Off Rates
DEFINITION:
Pass-through rates can be quantified as how many candidates successfully move from one stage to the next, also sometimes called conversion rates. This can be expressed in reverse as "candidate drop-off rate,” or how many candidates withdraw or are deselected from the process at any stage.
FORMULA/CALCULATION:
Calculation for the pass-through rate should be done for each stage of the funnel (application, screening, interview, offer acceptance, etc.) using the following formula:
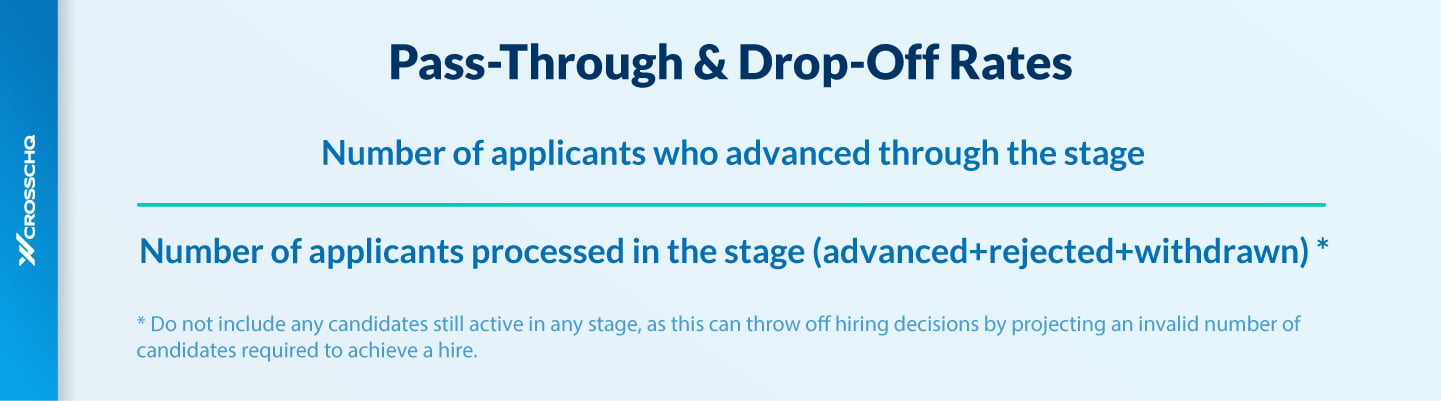
Like many key metrics, the pass-through rate is useful only to an extent—it shows yield, but that’s only part of an effective recruitment pipeline. Looking at who is abandoning the process instead of advancing is also very useful:
Low drop off early in the process can indicate that screening is not working as intended; for example, candidates are finding the number of assessments overwhelming, or the applicant tracking system filters are set in such a way as to eliminate too many applicants. Two lower than anticipated back to back drop-off stages in a row are a red flag for an inefficient process.
High candidate withdrawal late in the process can mean there is a disconnect between the recruiter and hiring manager or hiring manager and interview team. This could mean that the recruiter and hiring manager weren’t on the same page as to what constitutes a good candidate, or that the interviewer wasn’t in sync with the rest of the team.
BENCHMARK:
According to data from iMomentous, most companies have a roughly 80% drop-off rate during their application process. Average yield will vary by organization, industry, and job role. Ideally, organizations will also be looking at the makeup of candidates who successfully complete each stage, to identify where unconscious bias may be at work and to ensure DEIB initiatives are being supported.
WHO CARES ABOUT THIS METRIC?
Recruiters and hiring managers are typically the most invested in this metric, although the CFO may also be a stakeholder.
HOW TO IMPROVE THIS METRIC:
Candidate withdrawal is a complex metric. Depending on the role being hired for and the number of applicants, higher or lower pass-through may be desired. Pass-through rates can be optimized by:
- Closely watching the yield from stage to stage to identify any pain points where high-quality candidates may be withdrawing.
- Reviewing any potential disconnects between stages, such as a lack of prompt follow-up to move a candidate from one stage to the next.
- Ensuring your candidate experience is positive, and streamlining each stage as much as possible to avoid unwanted drop off due to frustration or lack of communication.
Interview Efficiency
DEFINITION:
Interview efficiency is most commonly defined as the number of interviews required to make an offer and the number of interviews to achieve an actual hire.
FORMULA/CALCULATION:


BENCHMARK:
Across all industries, the interview efficiency rate is currently rather high. The average interview-to-offer rate is 47.5%. The Interview-to-hire rate can vary widely depending on alignment between hiring managers and interviewers and the competitiveness of the market.
WHO CARES ABOUT THIS METRIC?
Recruiters, hiring managers, interviewers, and candidates themselves all are about these recruiter metrics. So do CFOs who understand the cost of labor, time, and recruiting expenses involved with getting candidates to the interview / offer stage.
HOW TO IMPROVE THIS METRIC:
Improving interview-to-offer and interview-to-hire rates is something you can work on, but it’s not completely within your control.
- Consider the competitiveness of the market for your specific candidate and their skills and find ways to offer more than competitors.
- Make sure everyone in the recruitment pipeline is clear on what is desired in a candidate to avoid wasted time in interviewing non-suitable applicants.
- Once a candidate knows they are up for an interview, schedule as soon as possible and follow-up after the interview to prevent highly desirable prospects from feeling ghosted.
Offer Acceptance Rate
DEFINITION
The offer-to-acceptance rate is the percentage of candidates who accepted a formal and unique job offer.
FORMULA/CALCULATION:

BENCHMARK
The average offer-to-acceptance rate is 69.3%. However, this recruiting metrics goal should be a rate above 90%; if you’re able to hit this mark consistently, and post-hire performance and retention bears out your Quality of Hire, you’ll know your recruitment pipeline has been well-optimized.
WHO CARES ABOUT THIS METRIC?
Interviewers and hiring managers have the most obvious stake, but so do recruiters who may be judged on how many people they pass through to the interview stage are actually fitting candidates.
HOW TO IMPROVE THIS METRIC
- Ensure your interviewers are well versed in their job. Research shows that the more interviews one person does, the better they are at spotting quality talent.
- Have interviews completed by a group whenever possible. This cuts down on unconscious bias that can come into play during a one-on-one interview.
- Remember that candidates are also using their time in interviews to evaluate the company, and make sure interviewers are aware of that fact.
Cost Per Hire
DEFINITION:
Cost per Hire is the entire cost of recruiting a candidate which can also include indirect costs incurred during the Time to Fill/ Time to Hire period.
FORMULA/CALCULATION:
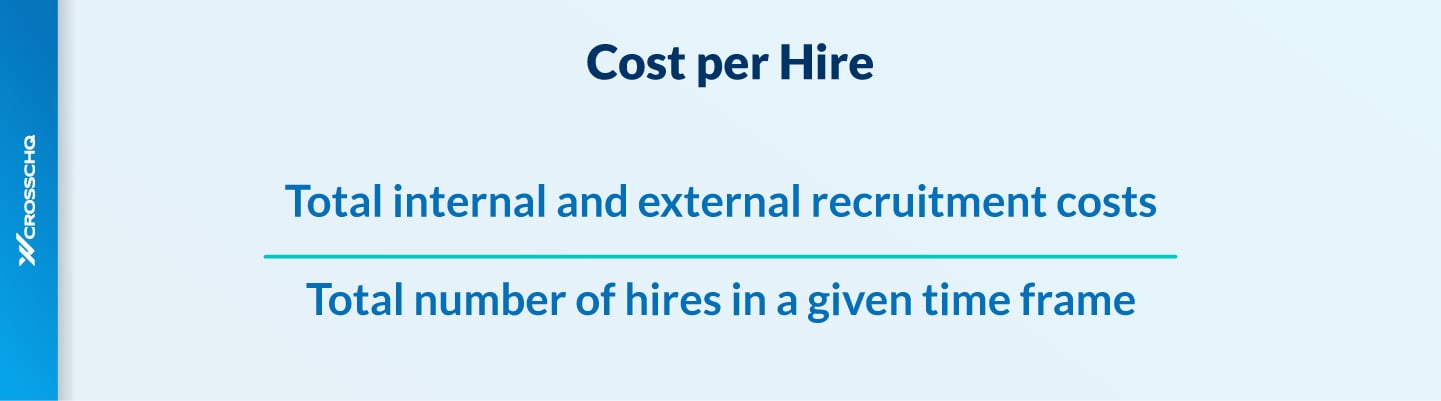
Total recruitment costs can include any of the following:
Internal recruiting costs
- Recruiter salaries
- Employee referral bonuses
- Interview costs (# of hours X hourly salary of responsible party)
- Fixed costs such as office rental
- Loss of productivity or revenues while roles remains unfilled
External recruiting costs
- Agency fees
- Advertising costs on job boards, etc
- Technology costs such as recruiting software
- Recruiting event or career/job fair costs
- Candidate costs for travel, relocation, and/or signing bonuses
BENCHMARKS:
- $3400: Cost per Hire for an entry-level employee
- $4129: Cost per Hire according to SHRM
- 16% of annual salary: Cost per Hire for a 30K or less job
- 20% of annual salary: Cost per Hire for a 75K or more job
WHO CARES ABOUT THIS METRIC?
Recruiters and hiring managers as well as the CFO are all stakeholders in this important metric, and will be closely watching recruitment costs to see if they align with the organization’s budget.
HOW TO IMPROVE THIS METRIC:
Cost per Hire ties in closely to Source of Hire, first-year attrition and Quality of Hire metrics. If a new hire quits before their probationary period is even up, the hiring process must begin again, and Cost per Hire applies again as well. Reduce Cost per Hire by:
- Identifying which hiring sources deliver high-caliber candidates quickly and cost effectively so that recruitment budgets can be allocated properly.
- Maintaining a comprehensive database of high-quality candidates that can be tapped when a new hire churns quickly.
- Creating high-quality hiring and onboarding processes to get new hires ramped up quickly for optimized production.
Candidate Net Promoter Score or cNPS
DEFINITION
Your cNPS measures how the candidate liked (professed loyalty or satisfaction) or disliked their experience of all the steps in your recruitment process. It can also be used to gain insight into their overall sentiment about your company, specifically if they would recommend applying to their family and friends.
FORMULA/CALCULATION
Candidates answer on a scale of 0-10, divided into three groups:
- 0-6 are detractors: Not likely to recommend the organization as a place to apply for a job
- 7-8 are passives: Not actively recommending your organizations as a place to apply, but also unlikely to be negative
- 9-10 are promoters: Highly likely to recommend the organization as a good place to apply for a job

The way NPS is calculated may be surprising to some people, since up to a 6 score is counted as a detractor. Since NPS was originally used as a measure of customer satisfaction, you may wish to be less severe in your separation of grades for candidate NPS and use a scoring system more like the one below:
- Scores above 0 up to 29 considered fair
- Scores between 30 and 59 are good
- Scores between 60 and 80 are great
- Scores above 80 indicate excellence
WHO CARES ABOUT THIS METRIC?
Anyone who cares about candidate experience is a stakeholder here. That can mean HR professionals, hiring managers, department heads, and the C-suite.
HOW TO IMPROVE THIS METRIC
- Keep top talent in the pipeline at critical points, ensuring that the application or assessment process isn’t so time-consuming, complicated, and burdensome it will turn off top talent.
- Shorten time to interview whenever possible; a fast, efficient interview scheduling process is critical when trying to land a high-quality candidate.
- Ensure that nurturing is part of your recruitment strategy, with a focus on making sure even “also ran” candidates look back on their experience as a positive one.
Read Next:
How to Deliver the "Wow!"
in the Candidate Experience and Increase Quality of Hire
Recruitment Target Accomplishments
DEFINITION
Are you hitting your targets when it comes to hiring the right people and hiring them in a timely manner? You have to set goals to see if you are meeting them.
FORMULA/CALCULATION:

BENCHMARK
You’ll have to set your own goal and measure against your goals to arrive at a benchmark. For example, your goal is to get your Quality of Hire up to 85 from 75 within 6 months, you have a target to hit. Remeasuring your company-wide QoH score monthly can let you see if you are making progress towards your goal and if you are on track to hit your target. If, at the two month mark, you’ve raised your score from 75 to 79, you’re doing well.
WHO CARES ABOUT THIS METRIC?
The CFO, HR executive, and others who need to justify recruitment costs and show results are all invested in recruitment target accomplishments.
HOW TO IMPROVE THIS METRIC
- Identify weaknesses in your various benchmarked metrics, and set goals for improvement with a clear timeline.
- Focus on improving those metrics without causing a detrimental effect to benchmarked metrics that are already high.
- Use tools that give you an easy way to prepare reports that visually show progress and can be used to inform and educate stakeholders.
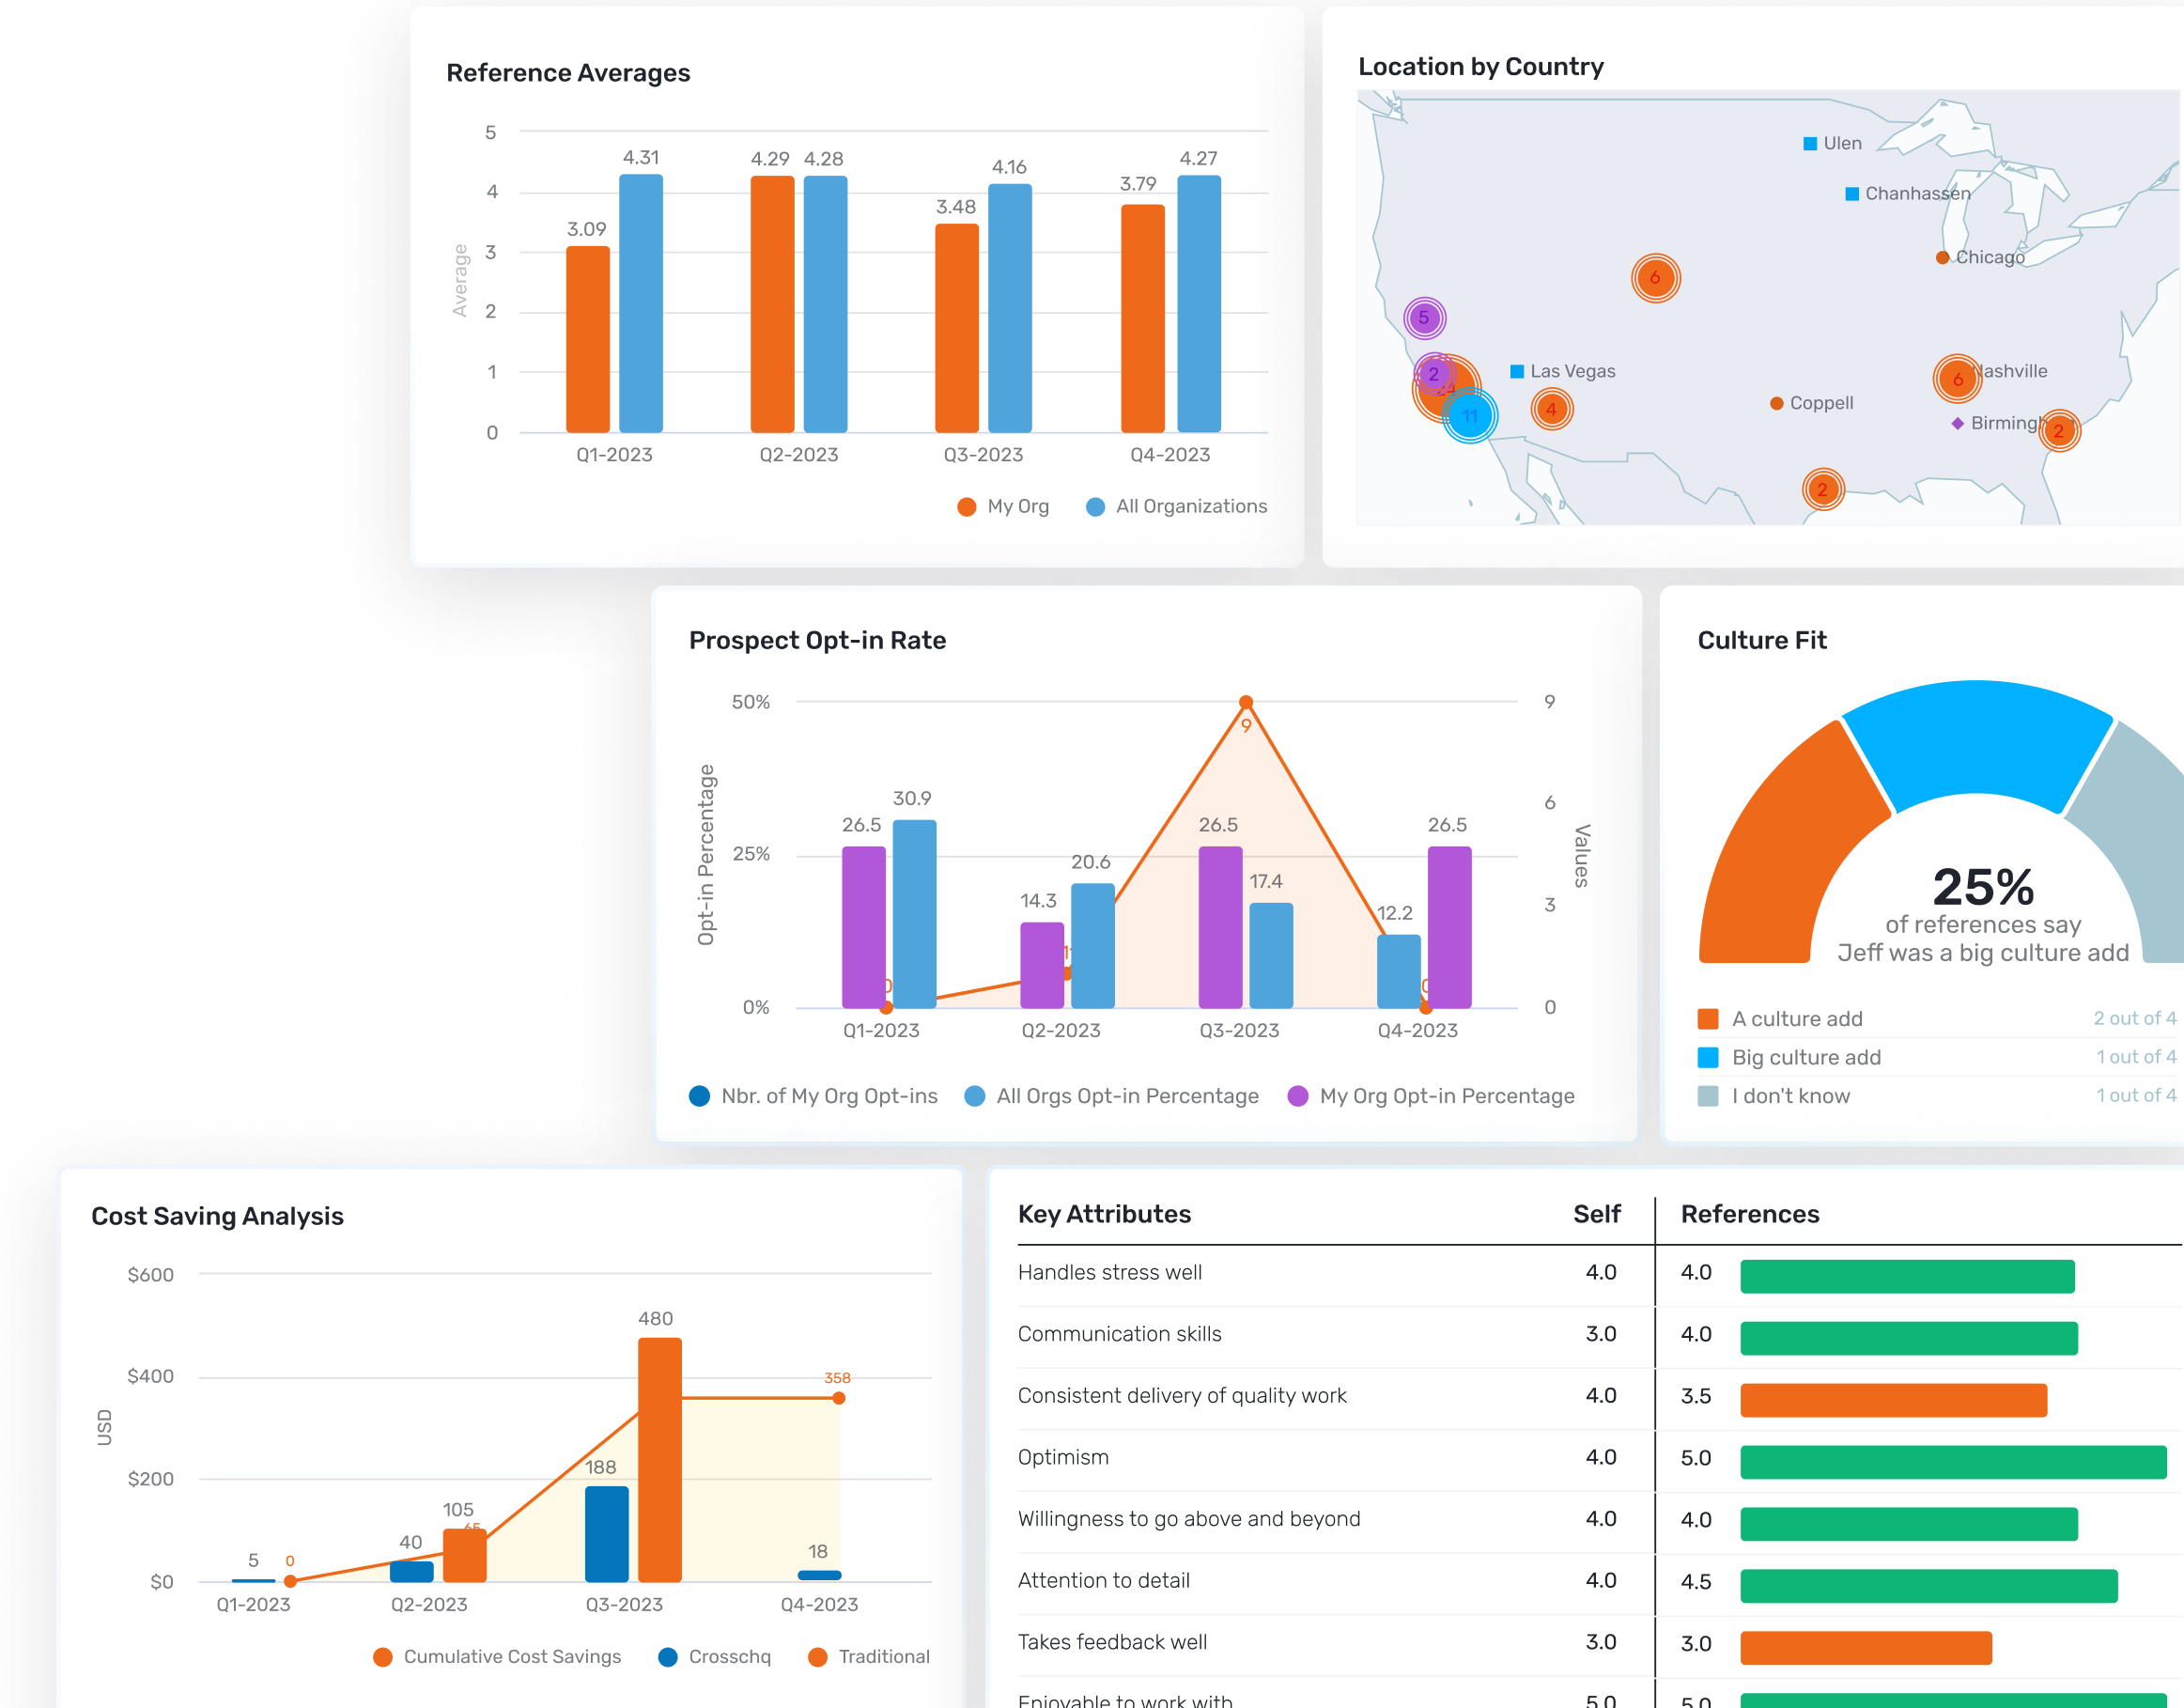
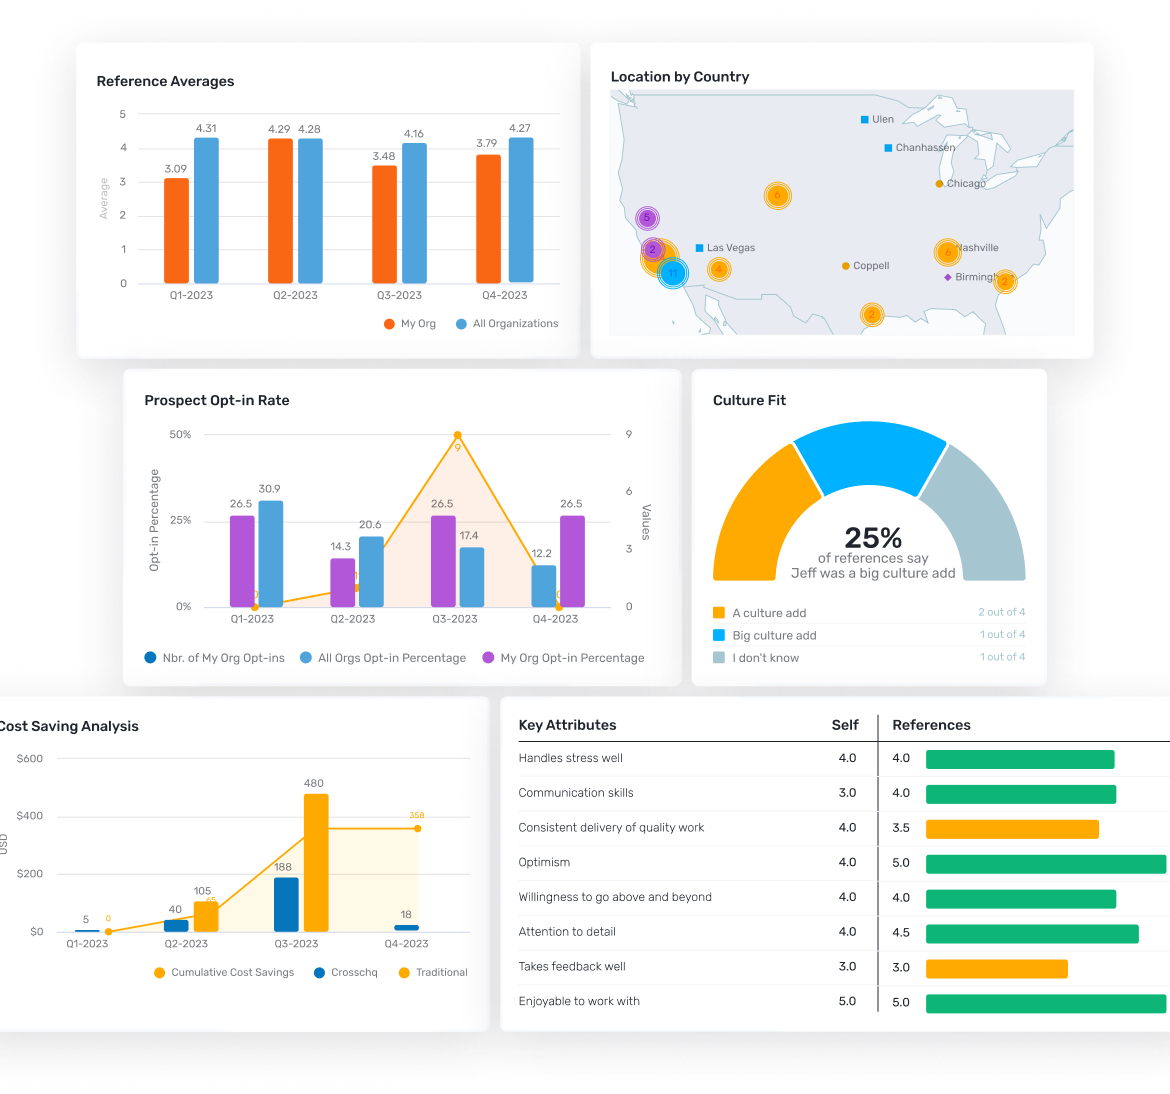
Better Talent Acquisition Benchmarking With Crosschq
Crosschq can help your organization improve its recruitment pipeline efficiency and allow greater visibility into critical benchmark recruiting metrics.
TalentWall™ by Crosschq provides deep visibility into the recruitment pipeline, from pass-through rates to candidate attributes and touch points. It’s the ideal way to track time-in-stage, and to note where candidate withdrawal is shrinking your pool of high-quality candidates.
Crosschq 360 speeds and optimizes pre-hire reference reporting, delivering data about each applicant to build a picture of their abilities and work ethics that can then be compared evenly across all candidates.
Crosschq Analytics delivers more than 100 customizable reports related to Quality of Hire, as well as, the ability to build surveys that can provide even more insights into post-hire performance and retention that can be used to inform future recruitment campaigns.
To learn more about how Crosschq can help with recruitment benchmarking and tracking key talent acquisition metrics for your organization, request a demonstration today.
.png)
by Katie Kennedy
Related Topics
Take the Guesswork
Out of Hiring
Schedule a demo now