%20-200x43.png)
.svg)
.svg)
.svg)
.svg)


.png)


Welcome to the fifth edition of our Quality of Hire Fast-Track Blog Series!
Understanding the impact of your Quality of Hire on pre-hire decisions goes far beyond calculating your initial benchmark scores. It’s critical to understand how Quality of Hire scoring affects and is affected by different factors unique to your organization.
Using data analytics can help surface insights related to your company-wide QoH scores as well as individual or hiring class scores, and identify area where improvements can be made. Before you can track, measure, and improve your scores, you need to know which KPIs to monitor.
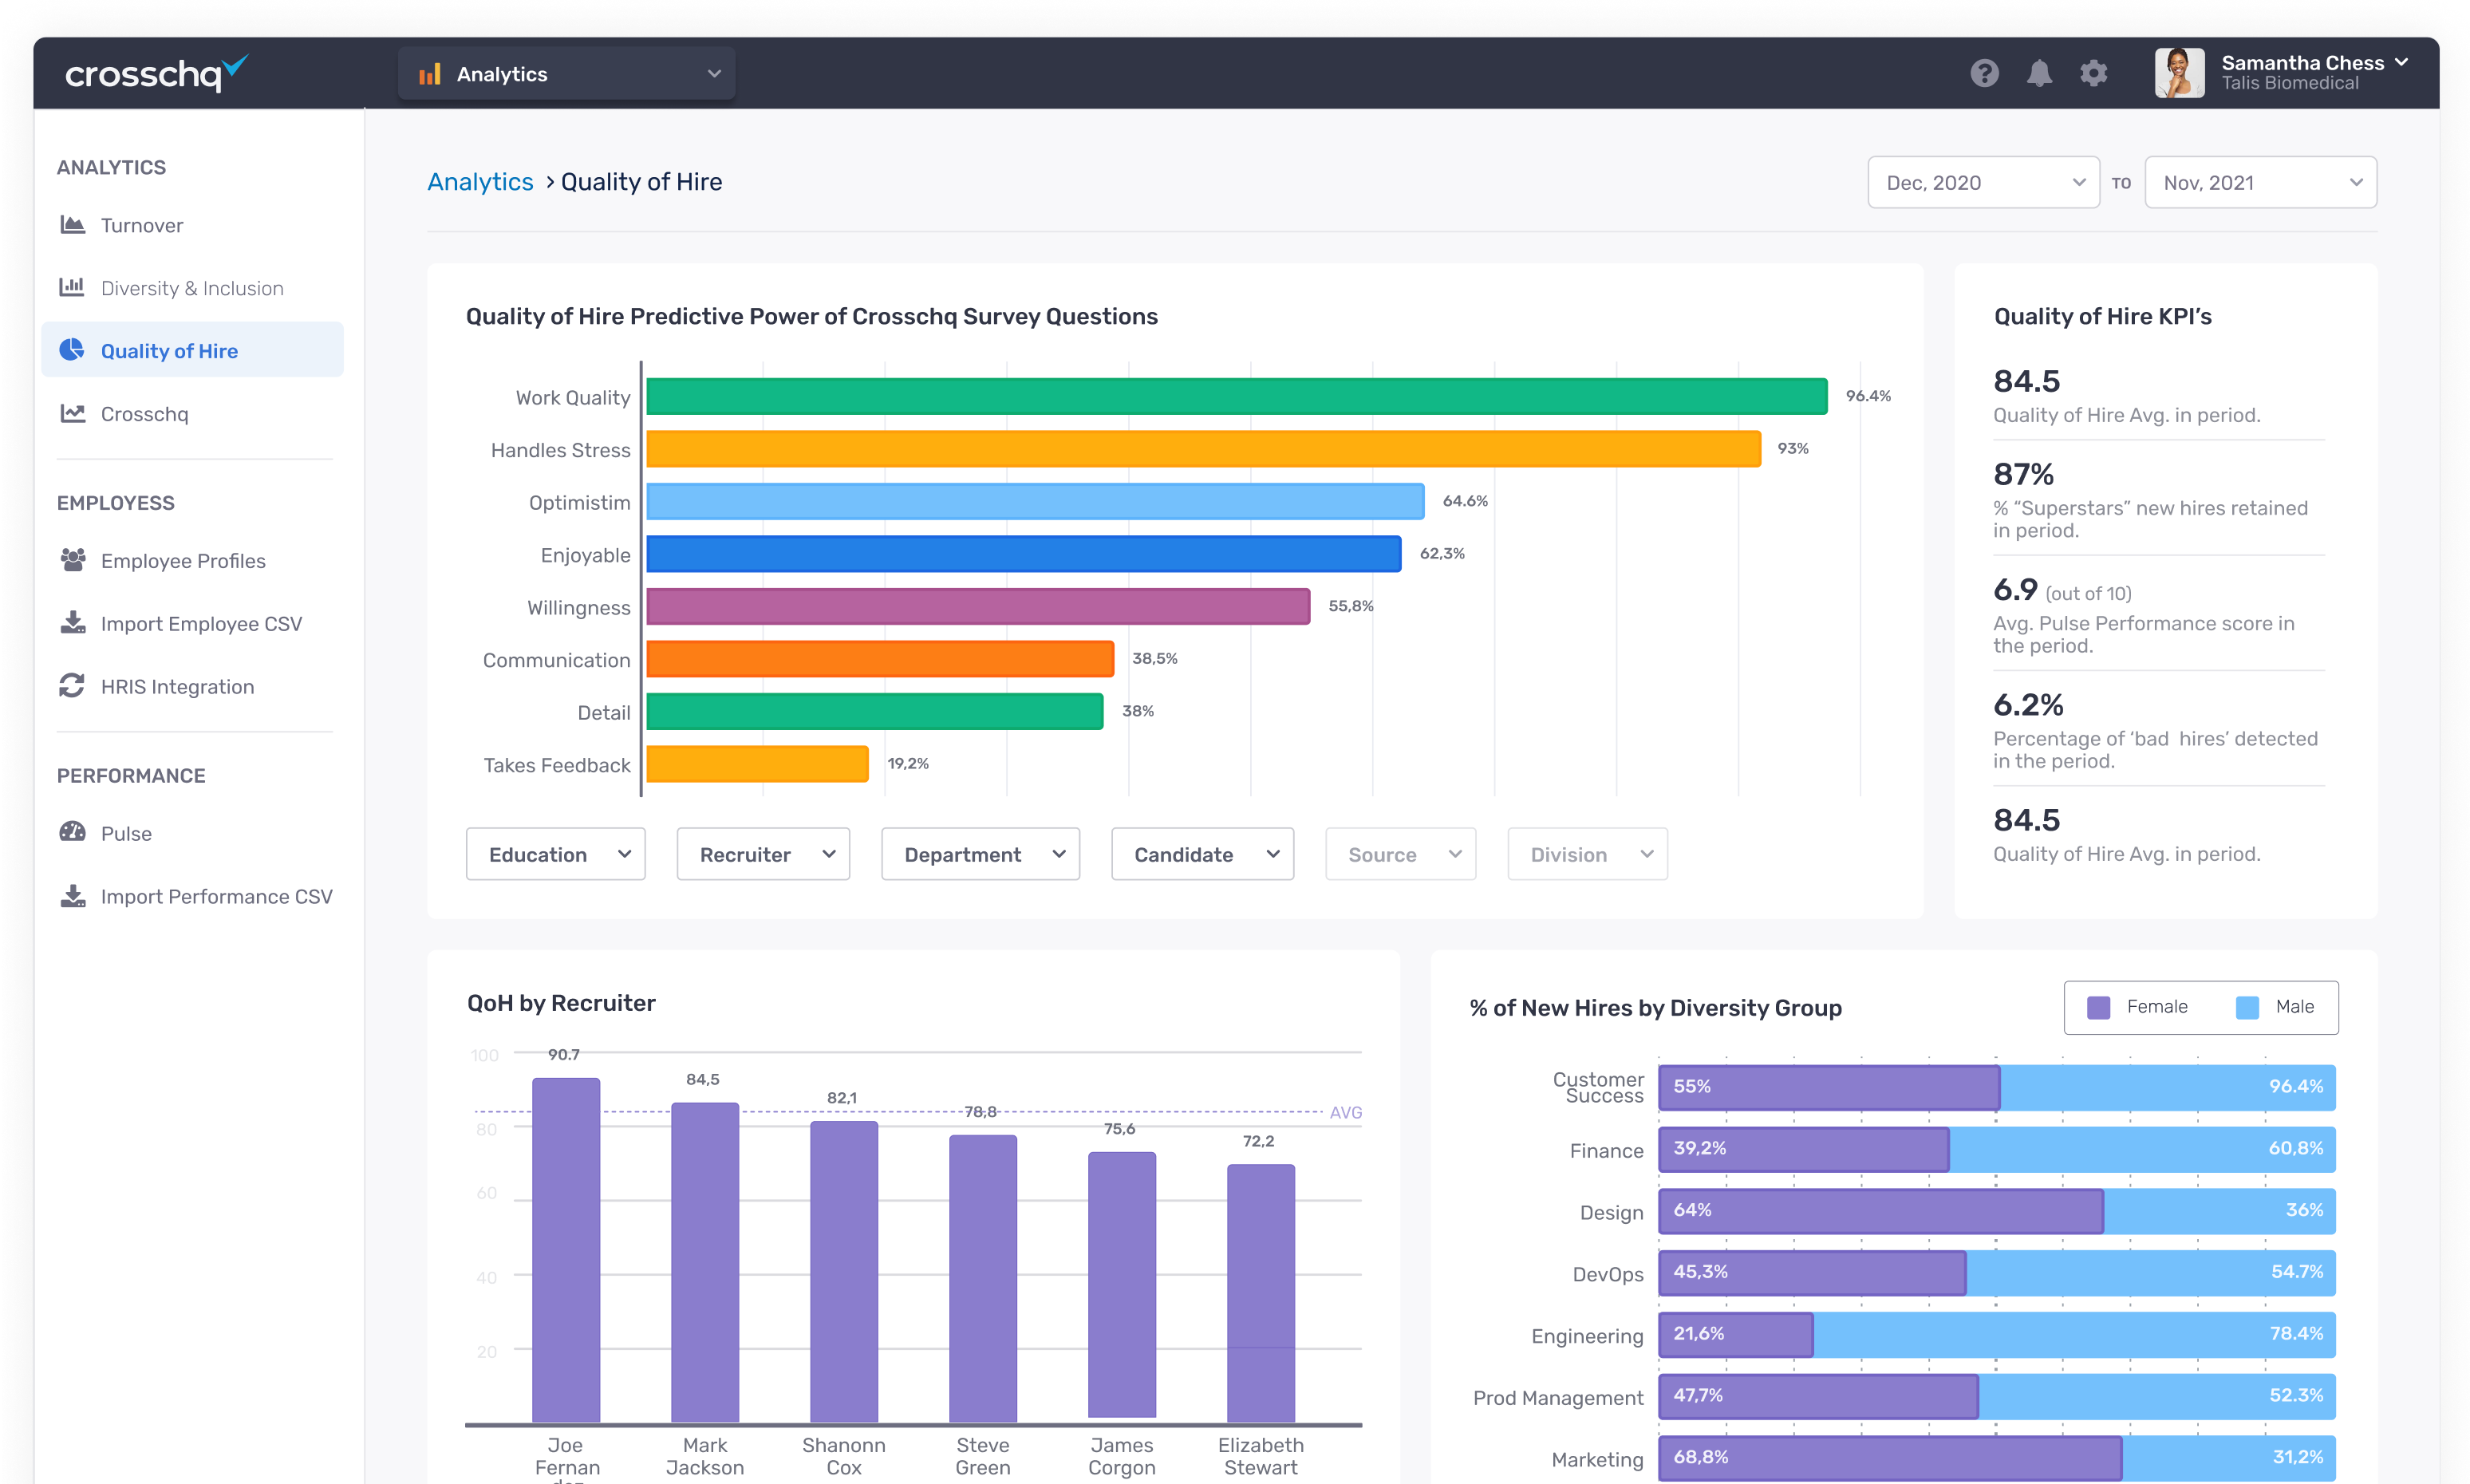
Quality of Hire KPIs to Watch
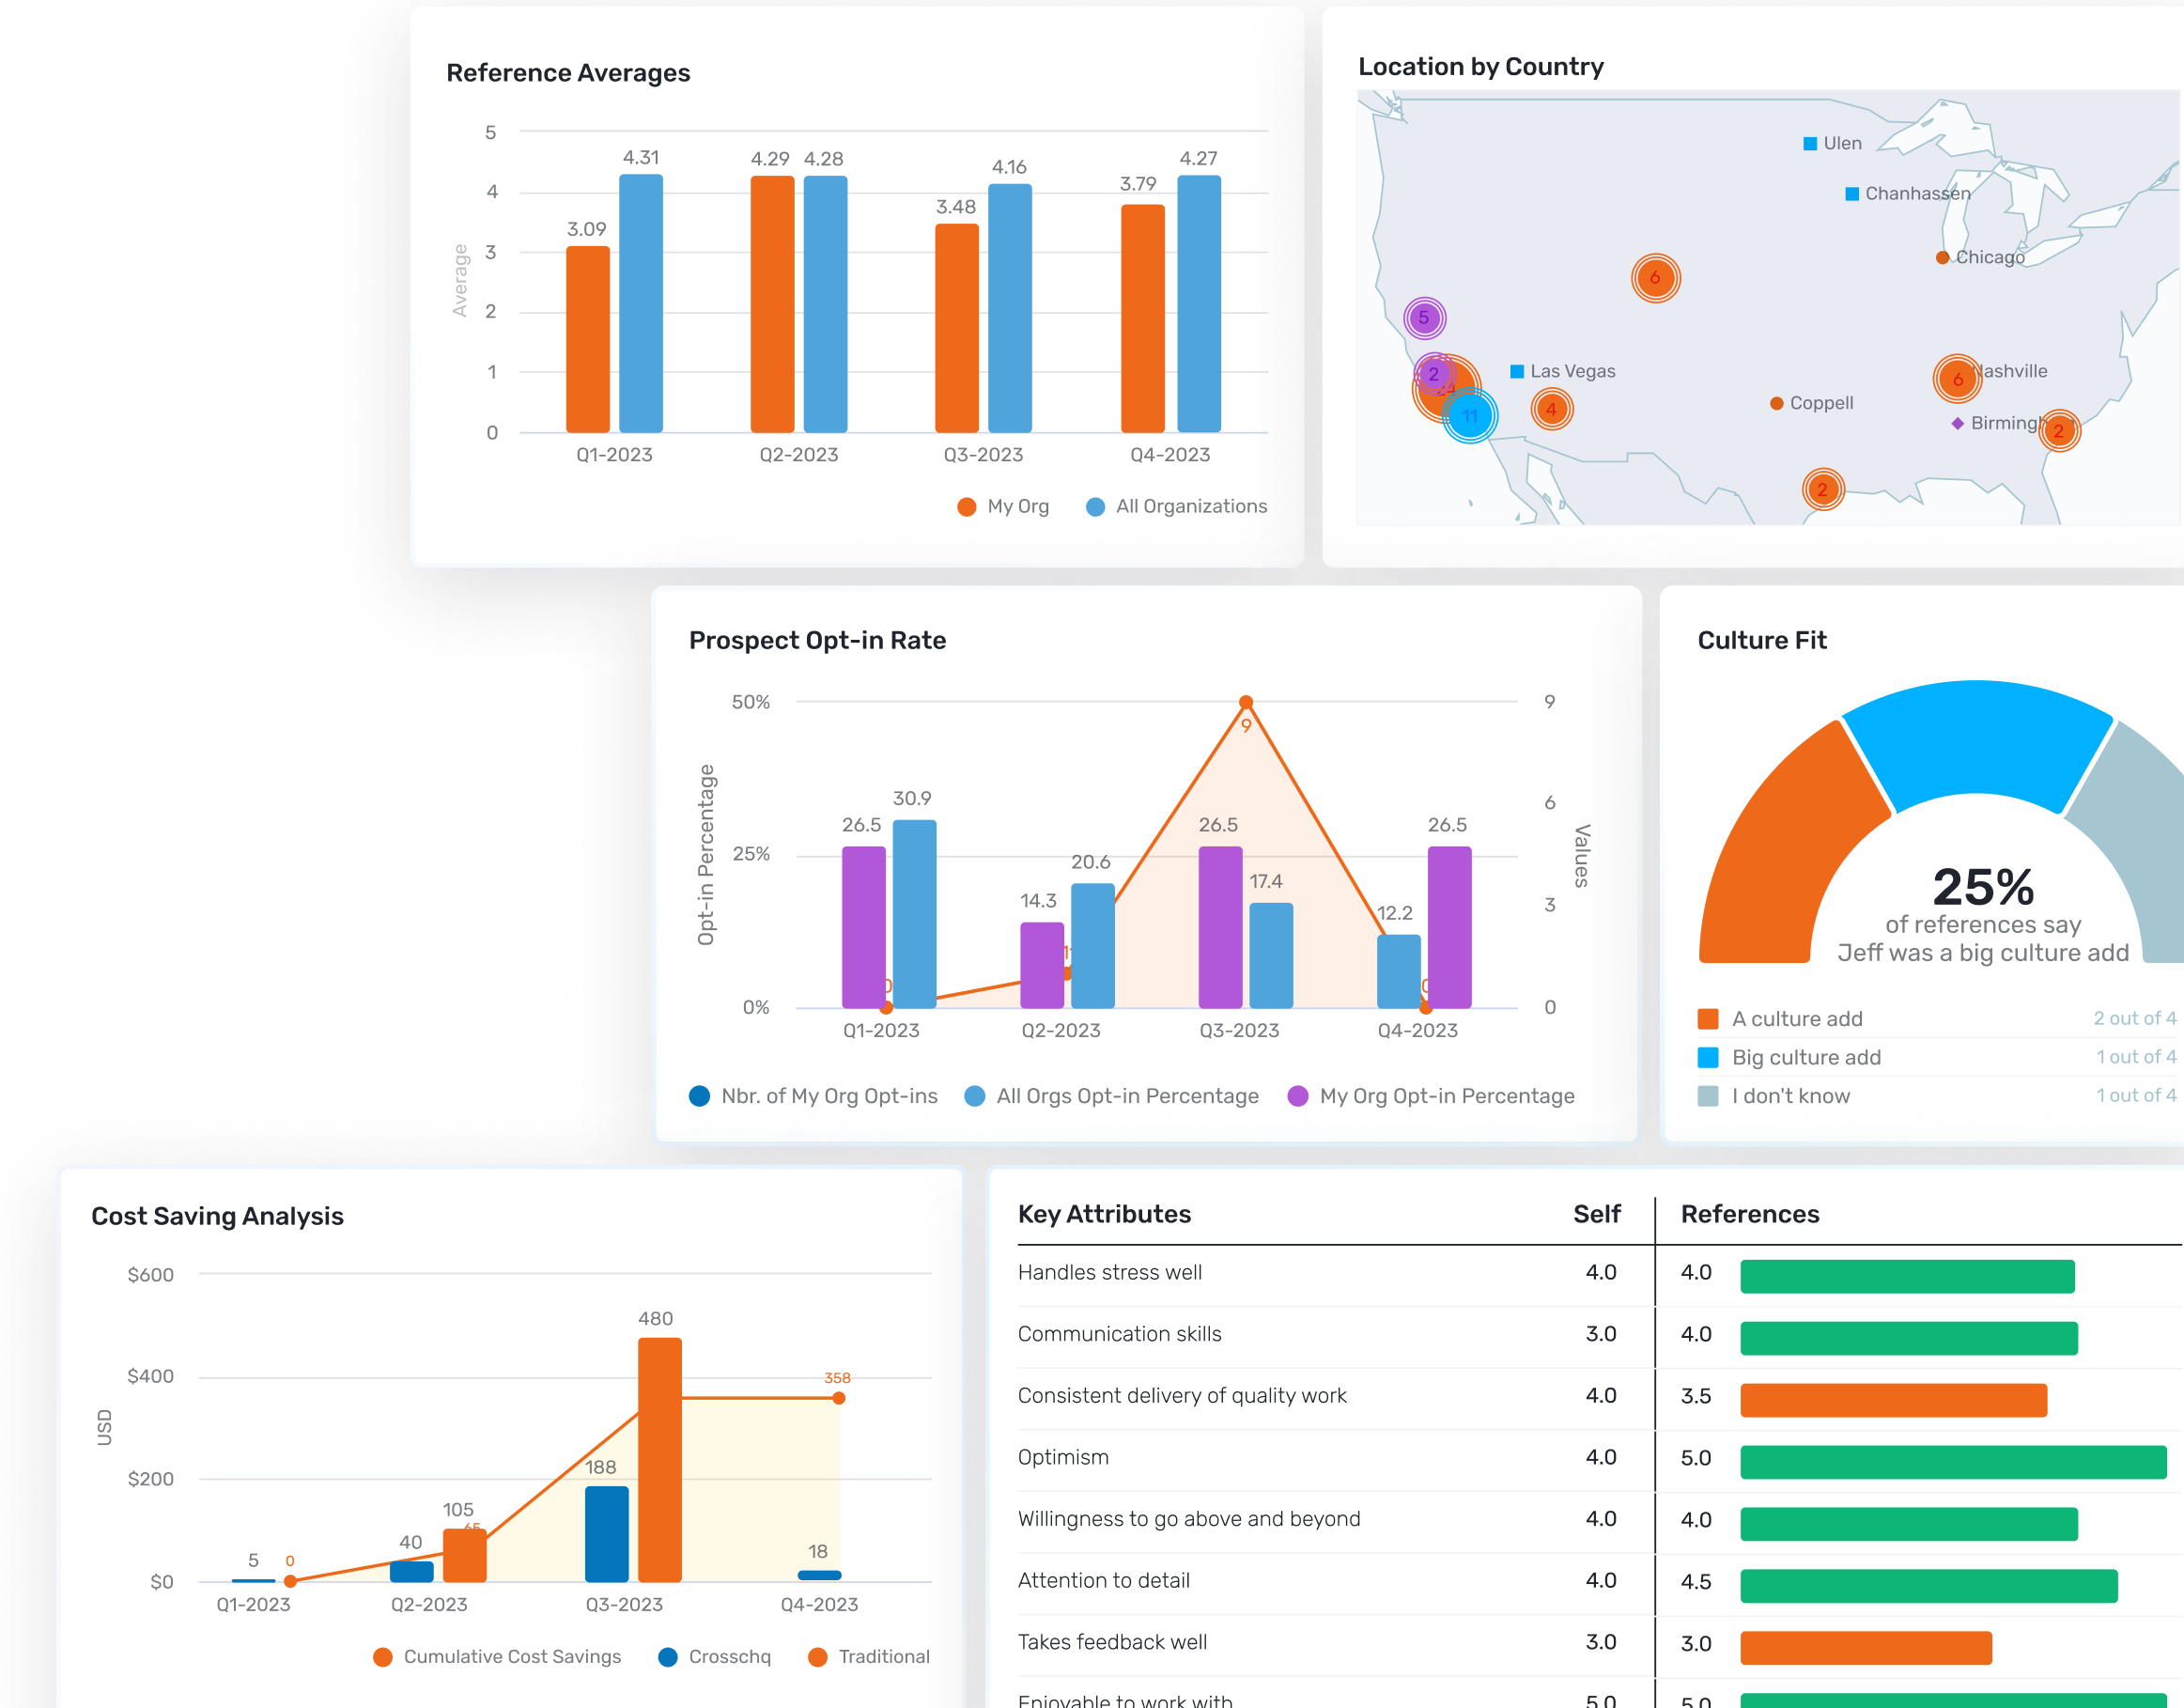
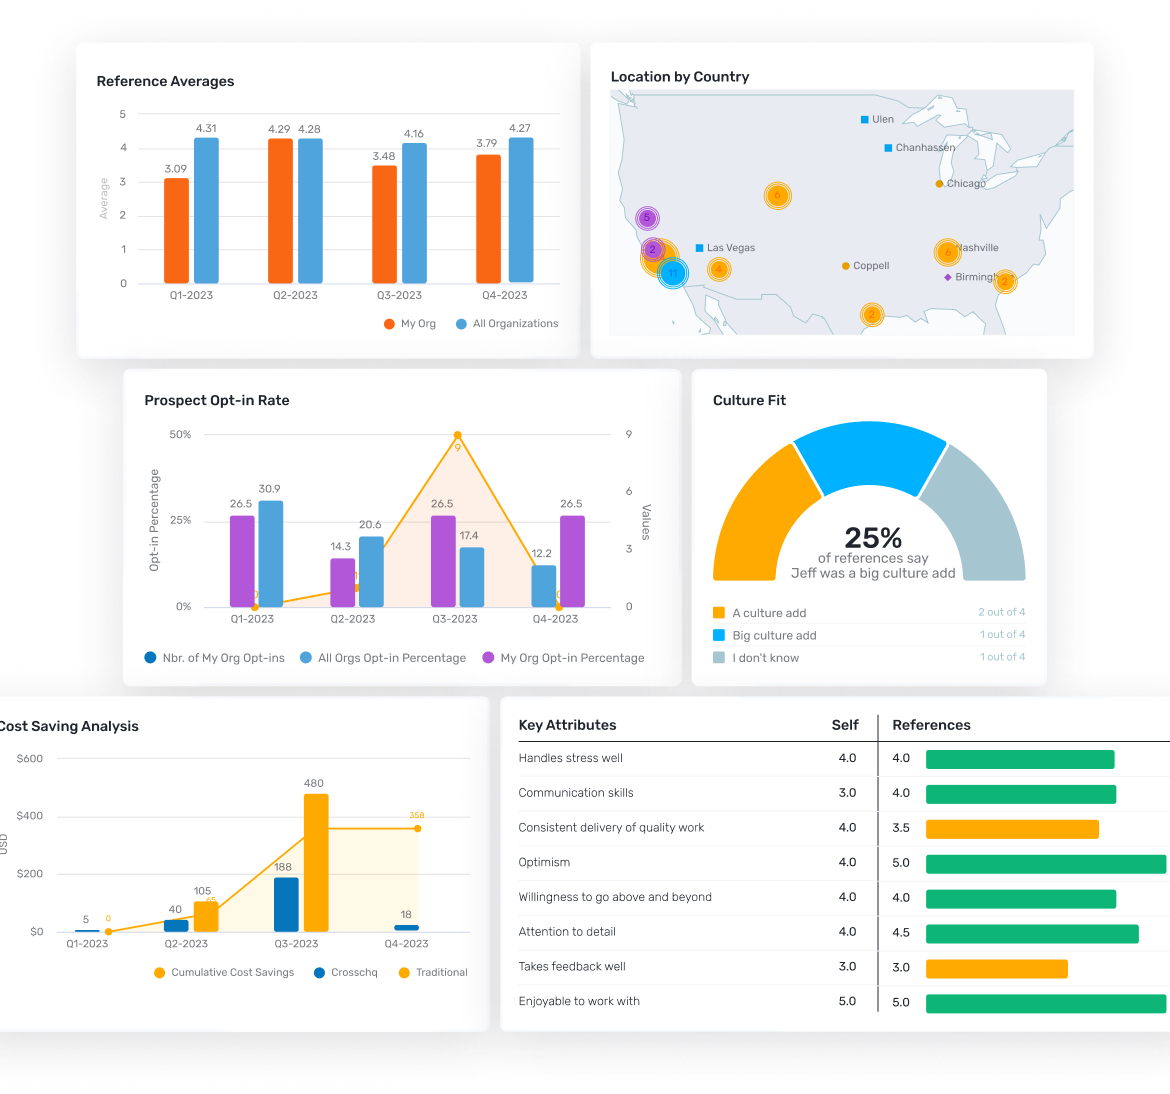
You can choose from dozens of Quality of Hire scores to maintain regular reporting on, and Crosschq Analytics can help. We deliver more than 80 different easy to assemble and understand reporting formats to use when explaining QoH to stakeholders.
Some of the most common Quality of Hire KPIs to keep an eye on include:
-
New Hire Average Quality of Hire
The average Quality of Hire across the board for new hires can let you know if you’re at least meeting previously set benchmarks. (Example: Are your new hires living up to standards set by current employees?) This is an easy metric to track over time, and to target for improvement.
-
% of Outstanding New Hires (Score Above 80.0)
This KPI lets you quickly identify top performers among your most recently hired employees. This allows you to target them for upskilling, leadership training, and positioning for long-term retention. If you’ve managed to land some exceptional talent, the last thing you want is for them to slip through your fingers due to lack of recognition and reward.
-
% of Failing New Hires (Score Below 40.0)
This KPI helps you swiftly see which new hires are struggling and not meeting performance expectations. They might be a bad fit for your company culture, they could have been slotted into a role they were unsuited for, or they could simply just be a bad hire. Keeping an employee on that brings down productivity and morale is worse than incurring the cost to replace them.
-
New Hire Average Performance
Performance is just one of a minimum 2-3 inputs needed to calculate QoH, but it’s a vital metric if, like most, your company’s bottom line is performance driven. You can separate and track this KPI by individual departments, recruiters, or candidate sources, and set targets for improvement over time.
Quality of Hire Trends to Track
In addition to individual KPIs, there are broader trends you can track to show how your recruitment and onboarding strategies are working over time. These include:
-
New Hire Quality of Hire Trend by Monthly Hiring Class
Why this trend is important: Tracking QoH based on monthly hiring classes lets you identify especially strong hiring cohorts. If several classes take an unexpected drop in post-hire performance, your onboarding process could be something you need to work on.
-
New Hire Quality of Hire Distribution
Why this trend is important: Understanding the QoH distribution of a hiring cohort can reveal insights into the potential impact of churn or low performers across your organization. Is your engineering department being repeatedly hit with employee turnover due to low QoH? Maybe it’s time to revisit hiring criteria and ensure recruiters and hiring managers are on the same page.
-
New Hire Quality of Hire Inputs
Why this trend is important: Understanding specifically which input(s), such as retention or performance, have been selected to drive your changes in QoH is critical. Without this understanding and forethought, it can be difficult to tie QoH metrics to organizational goals.
-
New Hire Quality of Hire Trend by Diversity Group
Why this trend is important: Diversity in the workforce has become increasingly important; it’s proven that diverse workplaces have higher levels of innovation and can even produce higher revenues. If diversity is lacking or you aren’t seeing the performance you’d expect from specific diversity groups, your culture and/or processes in place could be leading to lower performance or increased churn by group.
What’s Next?
This concludes our five part Quality of Hire Fast Track blog series. You can take everything you’ve learned and apply it to real-world situations inside your own organization.
Make a list of your most important metrics and trends to track related to Quality of Hire. The earlier you start tracking these metrics consistently, the faster you’ll get to understanding what you can fix or change to improve Quality of Hire.
For more resources, check out the following from Crosschq - our teams and solutions can help you:
- Tap into new sources for high-quality candidates
- Identify and fast-track high-value candidates, earlier
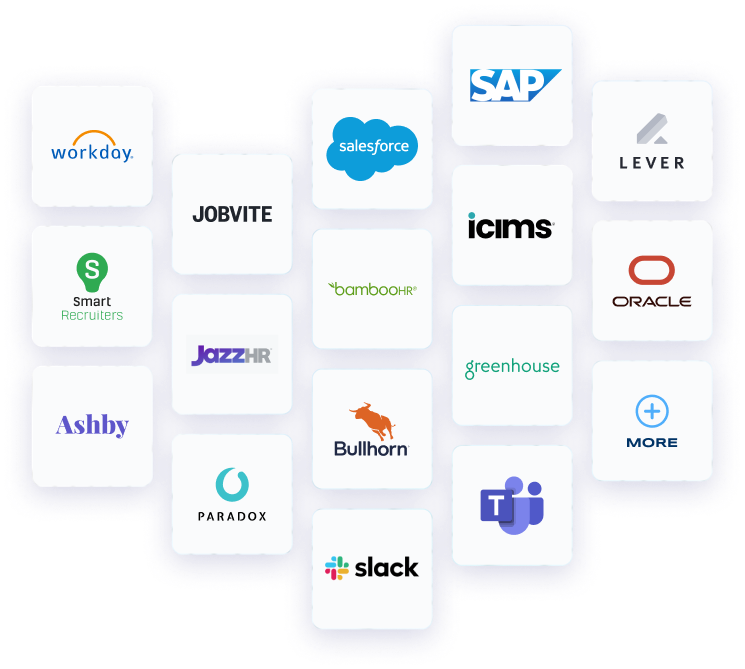
- Work more efficiently with your ATS to hire top talent
- Create beautiful, insight-filled reports in minutes
Of course, the more committed you are to improving Quality of Hire, the more complex it can get, and not everyone has time to devote to QoH measurement, tracking, and analytics.
If you’re ready to get real results quickly, Crosschq’s Analytics Tool gives you on-demand access to over 80 Quality of Hire reports, providing a single source of truth for new hire analytics. You can learn more about Quality of Hire Analytics and how to use this tool in our easy to understand Analytics reference guide.
Contact us today for a free demonstration of Crosschq’s Quality of Hire Analytics tool.
Quality of Hire Fast-Track Series: Everything You Need to Know
1. 5 Game-Changing Insights Into Quality of Hire
2. How to Calculate Quality of Hire in 4 Easy Steps
3. Taking Action to Reap the Benefits of Quality of Hire
4. Ignoring Quality of Hire: What Could Go Wrong?
5. Quality of Hire Metrics & Trends to Track (this article)
.png)
by Katie Kennedy
Related Topics
Take the Guesswork
Out of Hiring
Schedule a demo now